Bitcoin, Ethereum, Ripple, Litecoin Bearish, Lisk Smashed Down
“The main four” feels negative today as BTC/USD, ETH/USD, XRP/USD and LTC/USD lose nearly 2-4%

The currency pairs are red as top 20 cryptos have bearish moods today. The main loser for today is Lisk, which has lost nearly eight percent in the past 24 hours. The fundamental background is neutral as there is no events to influence the quotes significantly. However, general bearish moods may be explained by the investors disappointment with the results of Consensus 2018 Conference.
BTC/USD
Bitcoin has lost nearly three percent in the past 24 hours. The currency pair, in general, seems to hold its downside tendency despite the fact that it demonstrates signs of a deep correction currently. We have redrawn the red descending midterm trend line as the situation changes all the time.
Let’s have a look at the situation within the Fibo retracement formation.
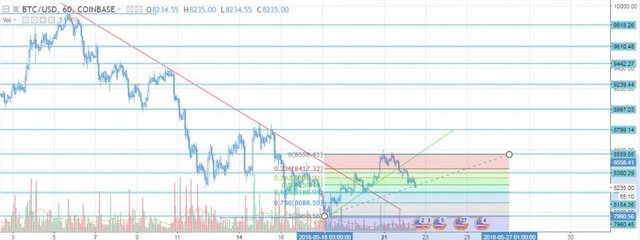
BTC price jumped off $8,559 area (resistance) and moved lower, breaking through several Fibo and support levels. The ascending green trendline was crossed without any difficulties meaning bulls had no power to hold this upside tendency.
BTC/USD continues to fall as it has broken through the next support area at $8,380 and approached the closest support area at $8,184.
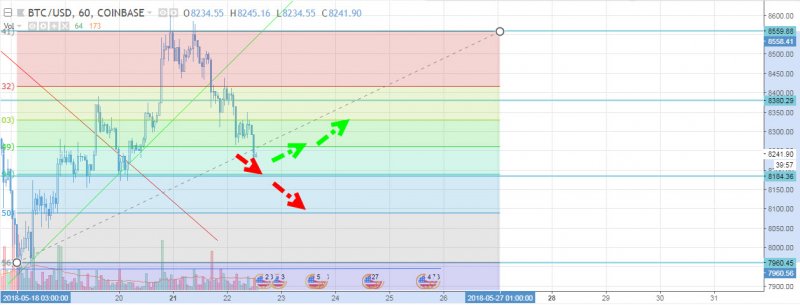
The possible scenarios for Bitcoin are the following:
BTC price will develop its downside progress and reach the support area at $8,184. It coincides with the Fibonacci retracement 0.618 level. If sellers successfully test this support, Bitcoin price will likely to fall even deeper towards the next retracement level (0.786).
Bitcoin will start to grow from the current level or from the closest support area at $8,184 targeting the closest 0.5 retracement level. If buyers are successful, they will have a chance to drive the currency pair even higher, towards the next 0.382 retracement level at least. The next resistance target is at the $8,380 area.
There will be no significant changes in price and BTC/USD will stay close to the current levels.
ETH/USD
Ethereum still holds bearish moods in the midterm. ETH/USD has lost nearly four percent in the past 24 hours. ETH price is above the midterm red descending trend line, but is not far from it. ETH/USD seems to have a deeper correction to the global midterm downside tendency. Ethereum price will fall even deeper this correction will be confirmed.
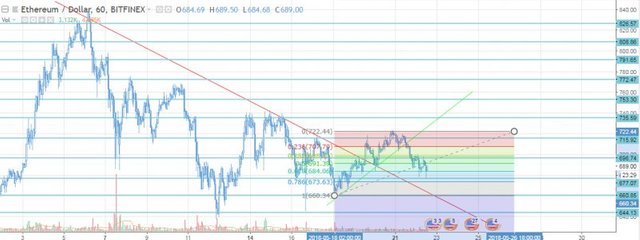
Let’s have a closer look at what is happening within the Fibonacci retracement indicator. ETH price is close to 0.5 retracement level currently. It has broken through several retracements and important levels including the green ascending trend line as buyers had no power to hold the uptrend. Ethereum price has also crossed two levels- $715.92 and $696.74. ETH/USD fluctuates close to the 0.5 retracement level in the moment of writing.
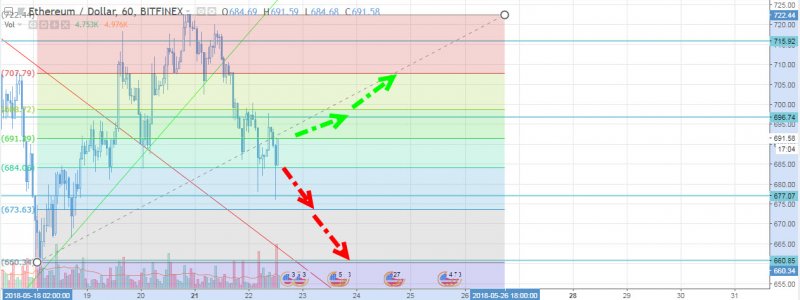
The possible scenarios for ETH/USD are the following:
Ethereum will jump off the 0.5 retracement level and run towards the closest retracement support at 0.618. If successful, sellers will have an opportunity to push ETH/USD even deeper towards the closest support area at $677.06. In the event that they are able to break through this level, sellers will likely to push the currency pair towards $660.85 support area, which coincides with one retracement level.
ETH price will jump over 0.5 retracement level and run towards the next closest resistance area at $696.74. If successful there, bulls will have an opportunity to drive ETH/USD further upside towards 0.236 retracement area.
The currency pair will fluctuate close to the current levels without significant changes.
XRP/USD
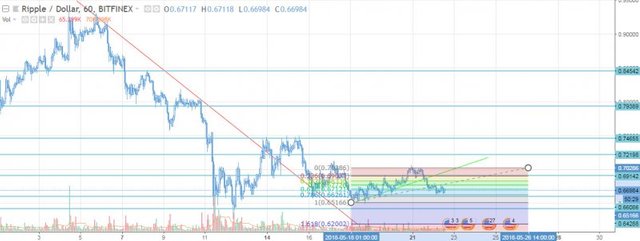
The currency pair has lost nearly three percent in the past 24 hours. It seems that XRP/USD has ended its midterm downside tendency as it fluctuates with no clear direction currently. Ripple has left the red descending trend line and the green ascending one. XRP price seems to stay within a horizontal channel in the moment of writing.
Let’s see closer what is happening inside the Fibonacci retracement. XRP price is close to 0.618 retracement in the moment of writing and seems to jump off this level. The closest support area is at $0.6608. Ripple has broken the support area at $0.6914 and several retracement levels since it has ended is upside correction to the bigger midterm downtrend.
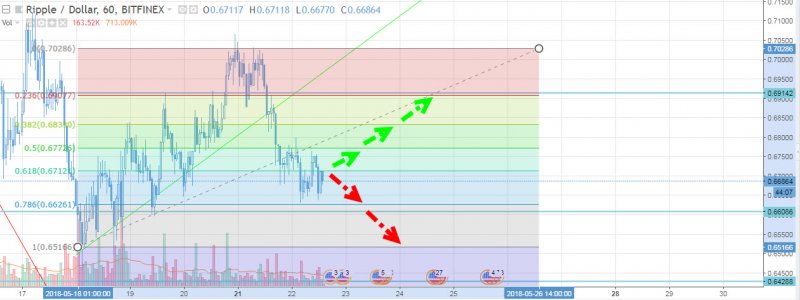
The possible scenarios for XRP/USD are the following:
The currency pair will run towards the closest support area at $0.6608, which coincides with 0.768 Fibonacci retracement level and test those areas. If successful, bears will be able to push XRP/USD even lower, towards the next retracement level at least. The next closest support is at $0.6428.
Ripple will run towards the 0.618 retracement level again. This one will be tested and if successful, bulls will have an opportunity to drive XRP/USD even higher towards 0.5 and 0.382 retracements. The closest resistance level lies at $0.6914 and coincides with 0.236 retracement area.
There will be no significant price changes in the nearest future and the currency pair will stay close to the current levels.
Check more details on LTC/USD and LSK/USD pairs HERE
Coins mentioned in post: