Bitcoin Update (BTC/USD) - Head and Shoulders Pattern has Formed...More Downside is Expected (09/07/2018)

In my last Bitcoin Update, I showed you the chart below that had two positive patterns in Bitcoin's price chart.
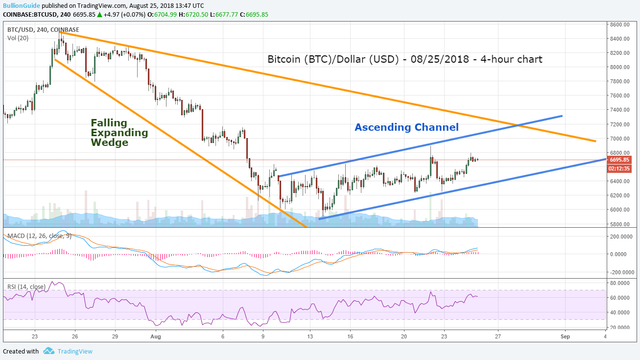
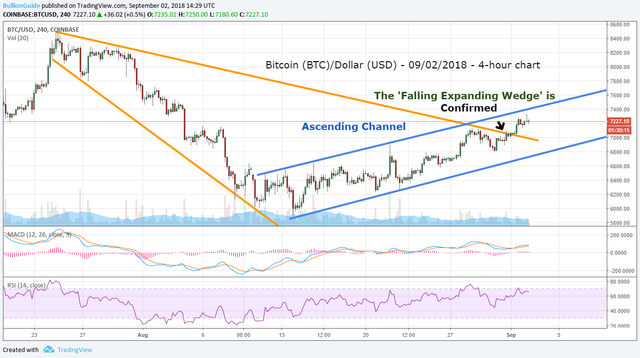
About a week ago, the Falling Expanding Wedge pattern in the chart above was confirmed and the price of Bitcoin continued to move up in the Ascending Channel.
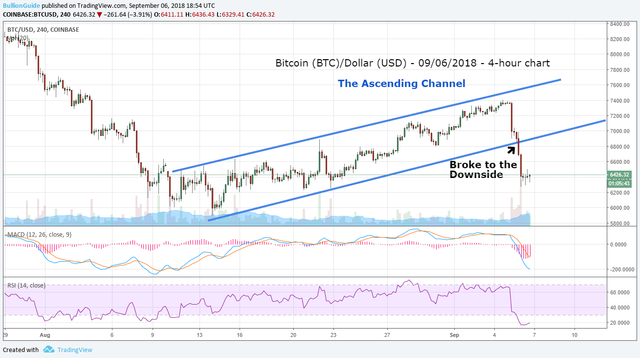
However, after bitcoin's price drop a few days ago, Bitcoin's price fell below the Ascending Channel, breaking its positive trend.
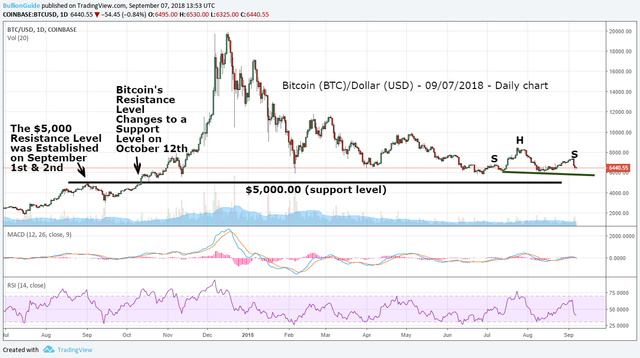
Now that Bitcoin has broken its positive up-trend, its price chart has now formed a negative 'Head and Shoulders' pattern, as you can see below.
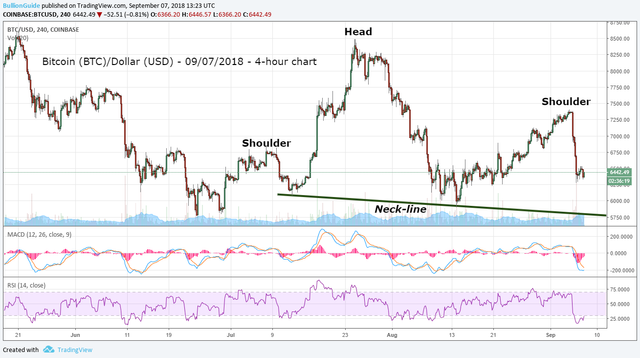
If the pattern moves as expected, the price of Bitcoin (BTC) should move below the 'Neck-line' sometime in the near future and when/if that happens the price of Bitcoin will fall below the $5,700 price level.
Furthermore, this will also bring the price of bitcoin close to the $5000.00 support level.
The $5,000.00 support level dates back to Bitcoin's strong move up in the 'Late Summer / Early Autumn of 2017.'
Bitcoin peaked near $5,000 around the 1st of September, and in doing so it established the $5,000 price level.
But then, Bitcoin fell in price until it convincingly broke through the resistance (now support) level a little over a month later.
These price movements in Bitcoin turned the $5,000 price level from a strong resistance level to a strong support level.
Hopefully, the $5,000 price level will hold because if it doesn't we could see prices fall as low as $3,000 in the short-term.
Overall my outlook for Bitcoin is negative in the short-term, but positive in the long-term.
So, when/if the Head and Shoulders pattern is either confirmed or denied, I will follow-up.
~
Thank you for your time, Every 'Vote and/or Follow' is Appreciated! Thank you.

Disclaimer: This is not financial advice.
The Charts provided courtesy of TradingView.com
Normally, I write about Gold Nanoparticle Cancer Research and I do technical analysis for silver, gold, and the U.S. dollar, but I'm also a fan of cryptocurrencies, and because of this, I've started to share my charts on the coins and tokens I own or follow.
My website is called: The Free Bullion Investment Guide, it offers anyone interested in the precious metals bullion markets an honest place on the web that provides bullion market reference material, bullion market news, and other market-related information. http://www.free-bullion-investment-guide.com/
Lastly, the bullion guide supports and sponsor's Gold Nanoparticle Cancer Research, half of every dollar it earns goes to this research through The Angel of Healing Cancer Research Fund. (This includes the money earned through steemit)
God Bless,
Steve Warrenfeltz