Bitcoin - Fib levels
I have complained over and over again about the tricky 2019 Fib levels. Well I went out and did something about it - I found them.
Yesterday I made it very clear that BTC was in a channel and that it should be viewed diagonally to make sense of it:
"Hear me clearly when I say this: BTC is not using horizontal support and resistance levels at the moment; it is using diagonal ones."
That post dealt with a broad channel. Today I want to dig a little deeper into the levels. I want to show them to you.
I actually found the levels some days ago. I didn't publish them then because I wanted confirmation of them, something the BTC price leap this week (and subsequent price action) has confirmed for me.
To the charts!
In my previous post I presented you this channel:
d":2960} -->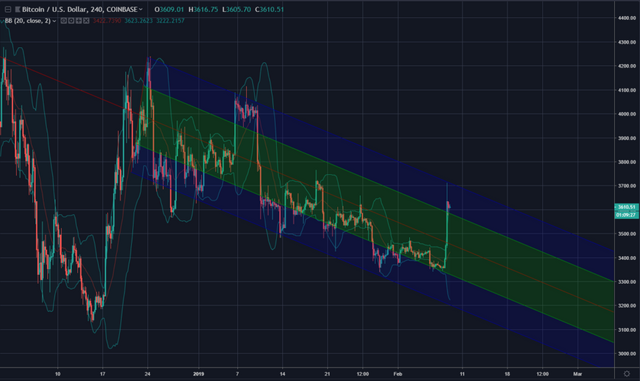
Here is what it looks like once the Fib retracement levels have been defined:
d":2951} -->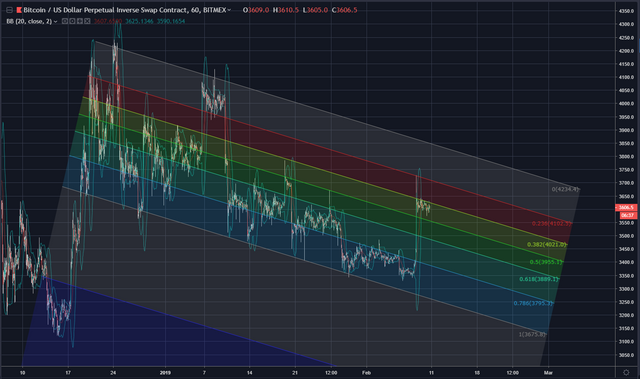
I strongly suspect that we will see a repeat of the January 6 - 10 price action (as highlighted in the block below). That will return BTC back to the vicinity of $3300 - $3350. Should the channel fail to hold at any stage, then Fib support should be met at $2850.
d":2952} -->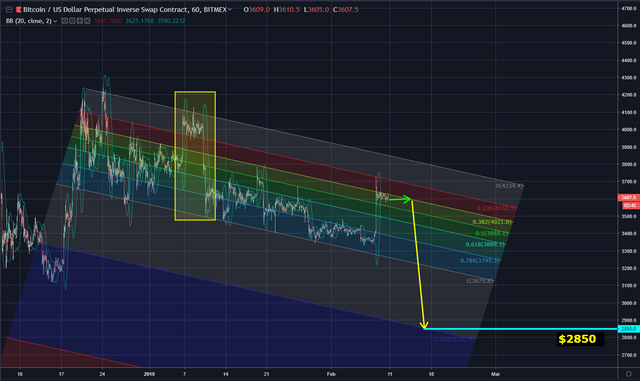
If I am wrong about capitulation already having taken place, then BTC may drop even further (I consider this highly unlikely - a 15% chance or less - and becoming less likely every day). But if BTC does drop below $2850 then it will find Fib support around $2260 (at which point I will buy the price back up myself!).
d":2953} -->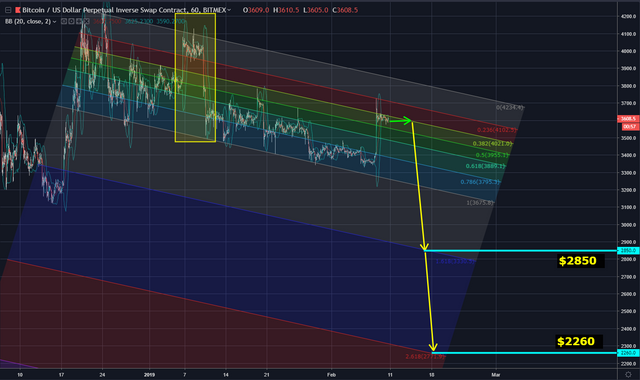
I am confident in my $2850 support level, you may remember I mentioned the same figure in my previous post:
"We have reached long-term support levels, which will make it difficult (but not entirely impossible) for BTC to perform another major price drop. Even if it does drop now in some form of “final capitulation”, it shouldn’t drop below about $2850. "
The chart below is my long-term analysis chart. You can see parallel lines in red representing the turnaround area. They are based on the beginning and the end of the January 2015 capitulation event. In addition to that I have pasted an exact replica of the 2014/2015 BTC market over the current one. It is from this chart that you can also read off a figure of about $2850 (provided that you can zoom it in like I can), which is where I got that number from when I wrote my previous post.
d":2954} -->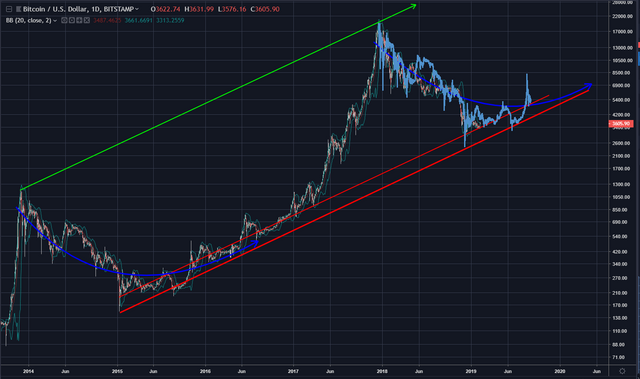
Talking about previous posts; remember my "4th of July Fireworks" post from two days back? It also ties in with this chart - and ties in well! The vertical line below shown where 4 July 2019 lies on the chart - right before it flys upwards.
I can't guarantee that I'm right, or even that I'm a good analyst. What I can tell you is that I am getting a lot of independent data which is pointing to the same conclusions. This is similar to what I described in my post about metadata based analysis at the start of this past week.
Either there are multiple rather large coincidences occurring - simultaneously - or I'm right.
d":2955} -->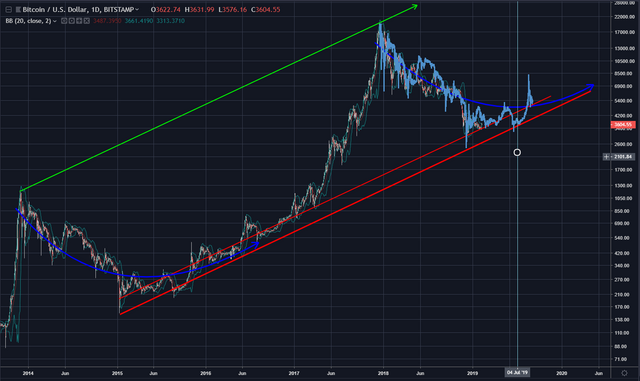
On the chart below I've just removed the copy-&-pasted 2014/2015 market so that you can see the current market cycle more clearly.
d":2957} -->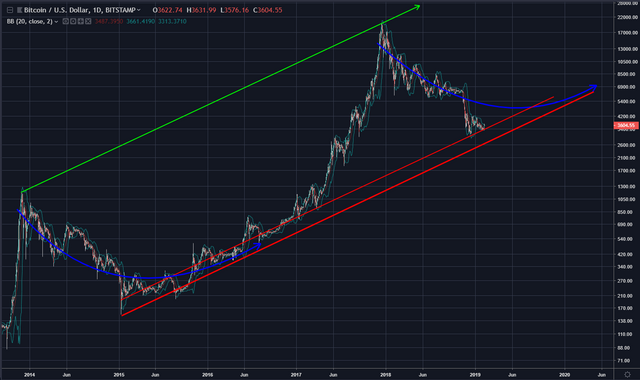
After looking at various support levels that BTC may drop to, I decided to do the reverse: see where it might meet resistance if price climbs. I doubt that this will happen soon, but there is always a chance. Spinning the Fib levels around I got a price of $4140 for the first major Fib level which lies beyond the top of the channel. The top of the channel itself lies at around $3800 and should also provide resistance. Remember that the channel slants downwards, so those prices all decrease with time.
d":2958} -->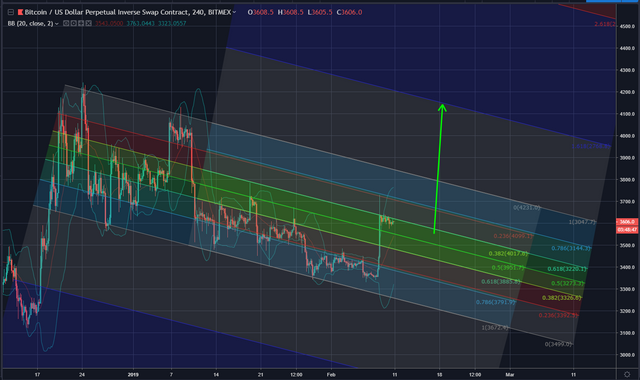
For the record: I estimate that BTC will do something similar to what is shown on the chart below for the next few days. Since fate enjoys laughing at my expense; you can expect BTC to do anything but what I've shown on the chart below! 😅
d":2959} -->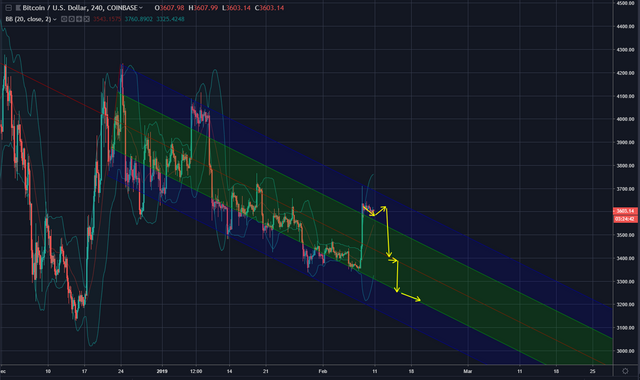
All charts made by Bit Brain with TradingView
Yours in crypto
Bit Brain

"The secret to success: find out where people are going and get there first"
~ Mark Twain
"By this means (fractional reserve banking) government may secretly and unobserved, confiscate the wealth of the people, and not one man in a million will detect the theft."
~ John Maynard Keynes

Bit Brain recommends:
Crypto Exchanges:
d":2563,"linkDestination":"custom"} -->

d":2564,"linkDestination":"custom"} -->

inkDestination":"custom"} -->

Published by BitBrain
on


You really jumped down the rabbit hole with this one. A lot to like here - good work. I'll check back in on these charts in the coming weeks/months.
Ha ha! The rabbit hole and I are old friends...
Wow...that’s some wild TA my friend. I tend to agree overall. Until the trend is broken, probability favors the trend. Right now, I continue to stack buys between $3,000 and $2,500. Should $2,500 break down, I think we could see a major sell off to $1,200-$1,100. I don’t think that’s likely to happen, but it’s certainly on the table. I’ll start getting excited again when we see daily volume consistently above $10 Billion.
Nice post BB.
Thanks man. $10 billion sounds about right. I'd like to see BTC above $6500 or higher, preferably above $8500 before I get excited again.
Great new approaches which we need to take into consideration as we are living in a bold new world in crypto and bitcoin itself.
Posted using Partiko iOS
Probably only a temporary situation, but it is an interesting one. You could say new approach, you could also say that I figured out how to apply Occam's razor.
Congratulations @bitbrain! You have completed the following achievement on the Steem blockchain and have been rewarded with new badge(s) :
Click here to view your Board
If you no longer want to receive notifications, reply to this comment with the word
STOP