BITCOIN ( BTC) DOWN MOVE
Bitcoin started to go down after hitting "19470" high level and it is still in downtrend ,
downtrend has not been over yet and it has more potential on downside , in my below
daily chart there are 6 indicators which are pointing to new down move .
1 : Strong Bearish Engulfing Pattern
2 : According to "ELLIOT WAVE THEORY" Expected Wave "C" has started
3: Weak resistance held at "11766"
4 : Bearish engulfing pattern formed at "38.2 "Fibonacci level
5 : Bollinger Band is pointing downward direction
6: Price is below SMA 50
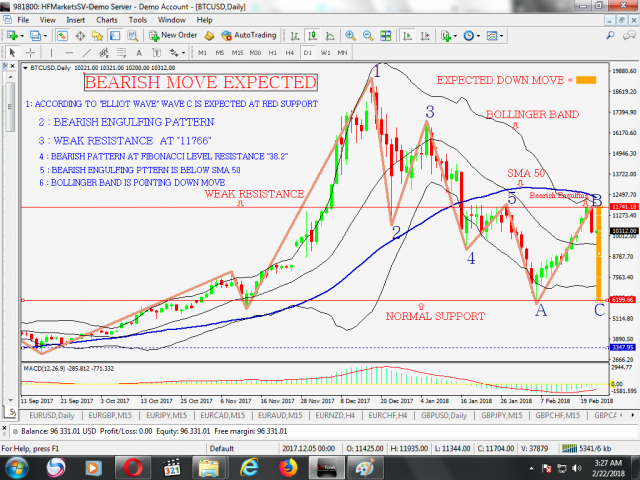
If price reacts according to above chart then next expected level is" 6200"
which is also a normal support level.
DISCLAIMER : It is not a financial advice ,it's my opinion and it's just for information and knowledge purpose .For trading or investment consult to your financial advisor and do your own research . If you trade or invest on the basis of my above chart or use my opinion then you are solely responsible for your trading or investment decision and any kind of loss associated to it.

Thank you for shareing
Thanks