Bitcoin’s Pivotal, Religious Moment of Transformative Truth Has Likely Arrived (Tomorrow)
I can now conclude with greater confidence that Bitcoin should bottom within 24 hours between $7.2k – $7.45k.

Bitcoin Jesus. My First Crypto Painting.
Note what I added to my prior blog Bitcoin Death Spiral Underway — or Something Else?, which I will quote again as follows:
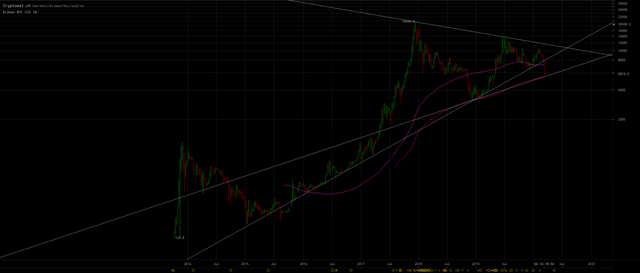
I’m expecting the superimposition of a tweening of a prior fractal similar visually to the following:
(click to embiggen)
[…]
Maybe Bitcoin needs to dump down to that ~
$7450level to scare the shit out of the altcoins and trigger the climax stampede?@masterluc’s
$6kPredictionSomeone wanted me to comment further on @masterluc’s
$6kprediction, which I had rebuked in my blog Bitcoin Movements Ahead on the Way to the Moon about a month ago in February.Note @masterluc — who amazingly correctly predicted the December 2019 ~
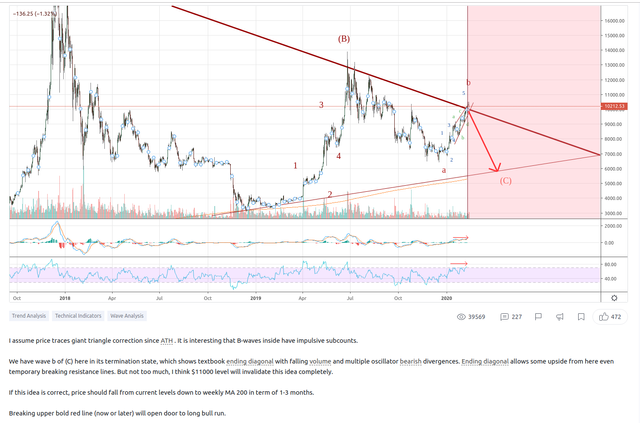
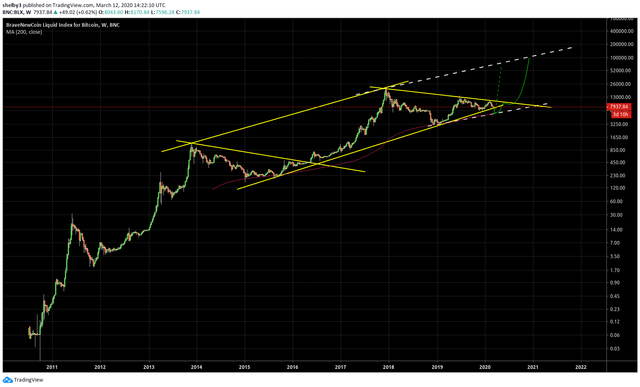
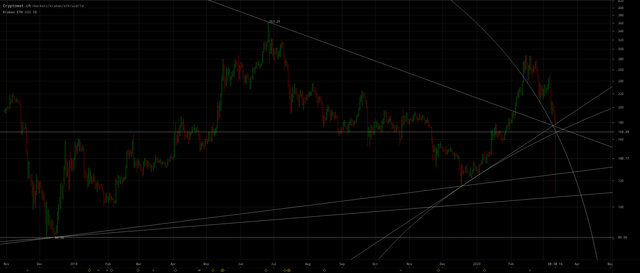
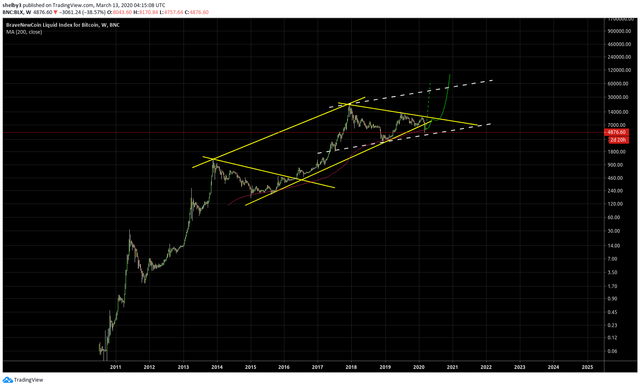
$6klow a year or more before it occurred — has often failed with his shorter-term predictions. And his recent updates appears it will be another incorrect prediction because in my opinion/analysis he has drawn the bottom of the wedge too low (by not intersecting the December 2018$3klow, which is marked “a” on his chart):
(click to zoom and read)I’m surprised he would (intentionally? deep state propagandist?) make that mistake because the line which correctly intersects the
$3klow has intersections with the lows going back several years and is a line that I think he has himself noted in the past. That’s one of the reasons why I’m confident he drew it incorrectly.[…] And he has a reasonable point that the overhead resistance for the top of the bullish wedge can be drawn lower than
$11.5kor even lower than$11k.And I can find evidence that @masterluc’s thesis for a correction may be correct — excepting as already stated in my opinion/analysis he drew the bottom of the wedge incorrectly and thus he exaggerates the severity of his posited correction and the duration for a potential move to the bottom of the wedge.
[…]
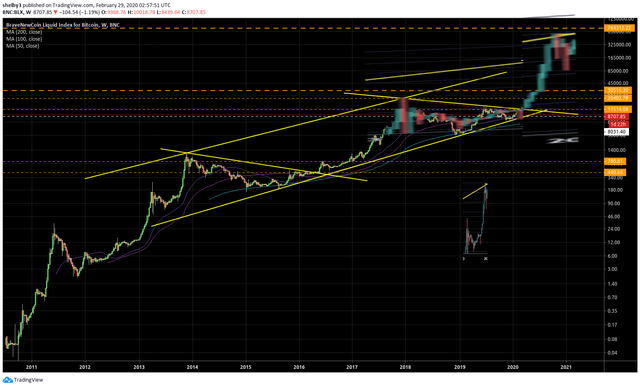
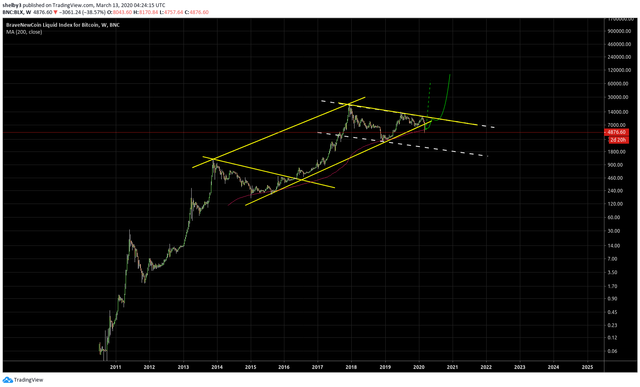
In that case, Bitcoin may be poised to decline back to the correctly drawn wedge bottom as it did in March 2019 perhaps before rising above
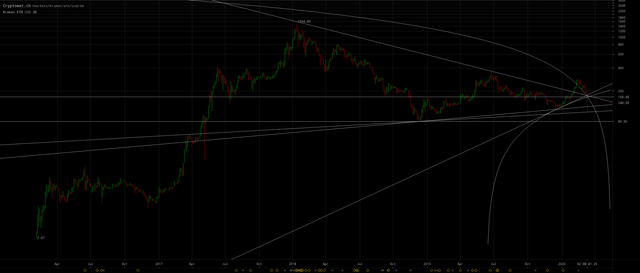
$11k.The logarithmic chart support line originates from 2016 (c.g. the chart earlier in this blog with the thick yellow annotated lines), but that applied to the
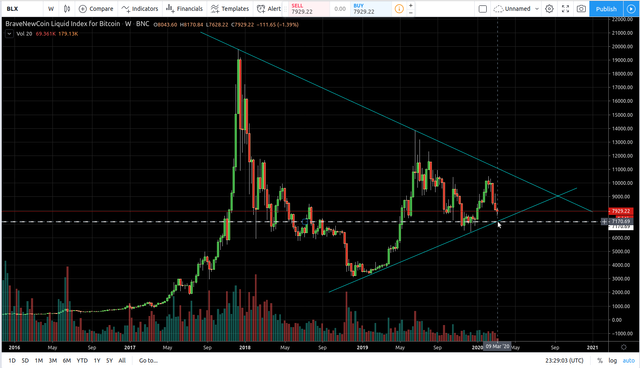
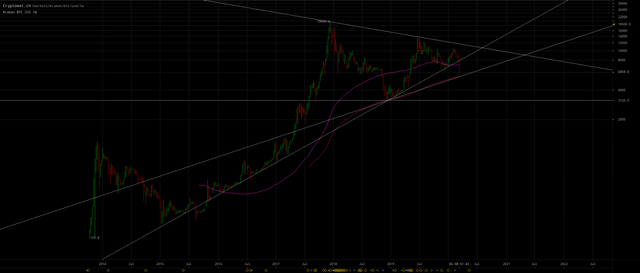
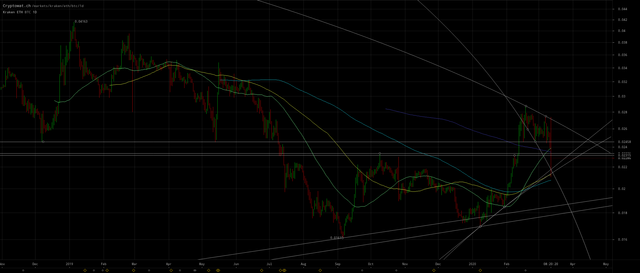
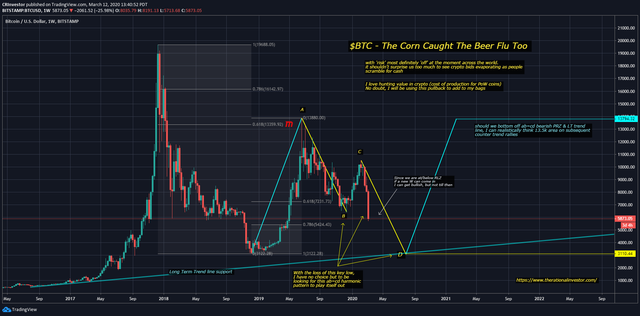
$3.1kbottom in December 2018. Since then a new support line applies on the linear chart (because it hasn’t involved enough duration and price expansion to require logarithmic market consumption). Or perhaps some interpolation between the two.Here’s how to correctly draw that support line on the linear chart:
(click to embiggen)Click here to view the live version of the above chart.
Note the expected bottom on the chart above is ~
$7.2k. Interestingly the Gemini exchange already registered a spike low to$7.3k. And Bittrex$7.0k.As Bitcoin breaks down to
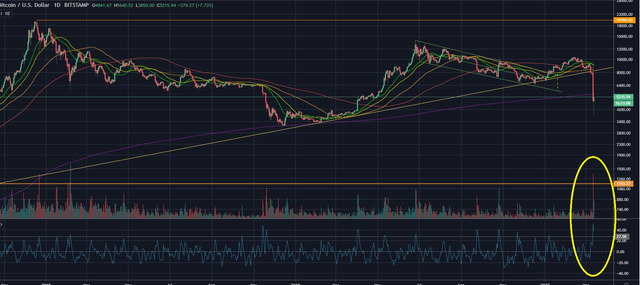
$7.2keveryone will panic thinking that it will fall to below$6kwhere the 200 WMA is. And that’s what it takes to make a major bottom. We need a massive panic. The volume is still too low. We need capitulation on the altcoins and a volume spike, when the bottom arrives. Coming soon…The deeper and more egregious this SLINGSHOT spike low, the more vicious and vertical the rise, because this will scare away the plebs so that the insiders can use their millions of printed-out-of-thin-air Tether to ramp up the price without too much leakage (i.e. they will just be mostly buying from themselves to mark the prices higher and higher). The greater fools will come back and buy the top as they always do, lol.
I can now conclude with greater confidence that Bitcoin should bottom within 24 hours between
$7.2k–$7.45k. The 100 WMA is also at ~$7.2k. Ethereum will likely bottom$169and Litecoin$43.I’m not just basing that on the cyan colored support line on the chart above. A confluence of lines on my recent charts all confirm those numbers. Those are also the bottom of the descending broadening wedge which I wrote about in my prior blog.
UPDATE 24 Hours Later.
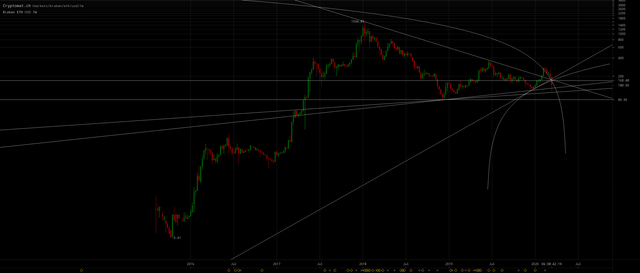
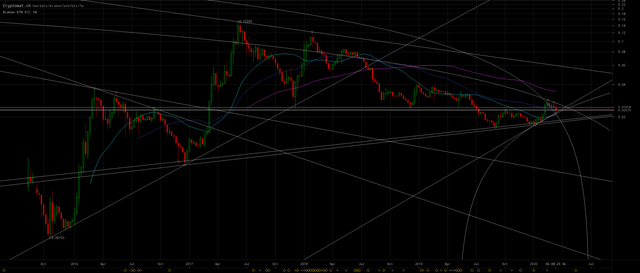
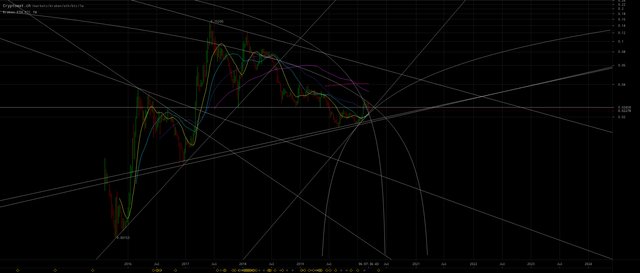
Oh my, what a transformation! @masterluc was correct on price and I was correct on the timing (i.e. flash crash):
(click to embiggen)
Click here to view the live version of the above chart.
@masterluc drew incorrectly on the log-scaled chart because he was expecting a slower decline. I drew it correctly but on the linear-scale (vertical axis) chart. Turns out the correct line T/A positioning was mine, but drawn on the log-scaled chart and with a straight drop out of the bottom of that first-time-ever-seen-for-Bitcoin descending, broadening wedge. That peculiar technical analysis structure was causing me to notice that something dramatic was about to happen. I even mentioned that the @masterluc could only be correct if it dropped straight down. I just didn’t expect it actually would!
The price declined to the 200 WMA which is currently ~$5.5k:
(click to embiggen)
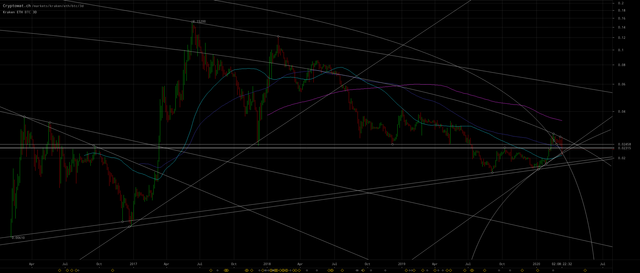
Note this delays/alters the hypothesis from my prior blogs such as Bitcoin Death Spiral Underway — or Something Else? to this realization:
(click to embiggen)
Click here to view the live version of the above chart.
Delayed Timing of Posited SegWit Donations Attack
It now seems quite implausible for the posited SegWit attack to start on May 14 — as depicted by the dashed green line on the chart immediately above — unless BTC/USD will fall out of drawn wedge and crash (seems unlikely to me).
Therefore I can only conclude that any SegWit attack would begin after May 14. Perhaps when Craig Wright issued a “long-term advance notice” about a future attack “aligned with a reward halving” (c.f. also, also, also), perhaps he meant after the halving but at no specific date after it. Or perhaps he meant the halving in 2024 — not Craig wrote ‘a’ not ‘the’ reward halving.
The word ‘aligned’ means “put (things) into correct or appropriate relative positions”, not necessary in the same position. After the mining reward halves it takes some months or by Moore’s law up to 18 months for the efficiency of the new ASICs to regain same profitability at the same price as before the halving. Thus the attack could come months or up to 18 months after the May 14, 2020 halving.
Bottom?
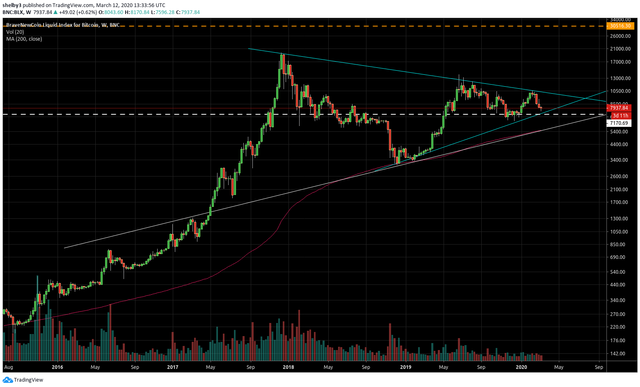
Have we reached the bottom or is a triangle with a horizontal support instead of a wedge?
(click to embiggen)
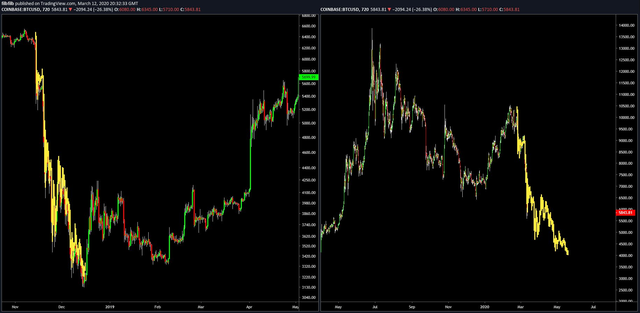
Here’s the weekly, three-day and daily charts for ETH/USD:
(click to embiggen)
Perhaps we can get some clues from the weekly, three-day and daily charts for ETH/USD:
(click to embiggen)
From the weekly clearly ETH/BTC is still very bullish. Thus ETH/USD must be also. ETH/USD did a head fake first popping up in a breakout from its wedge, then falling back into it on this flash crash. There were too many wide-eyed, FOMO Ethertards rushing in too soon, so had to lead those sheepeoplepigs to slaughter first before resuming the bull.
For both ETH/USD and BTC/USD to return to horizontal support at $80 and $3120 respectively, would cause ETH/BTC to rise to 0.0256 while the market is crashing, which seems counterintuitive.
Also ETH/BTC has bottomed at the 200 DMA and was not near the top of the wedge, so not necessary for it to return to the bottom of the wedge. Thus I conclude that ETH/BTC has or will likely bottom(ed) ~0.021, although it could still drop to the bottom of its wedge ~0.018.
Thus ETH/USD and ETC/USD may decline to confirm the bottom ~$115 and $5550 and thus ETH/BTC at its 200 DMA 0.02075. Possibly ETC/USD and ETH/BTC decline to ~$100–$103 and 0.0018–0.00185 respectively.
Another clue that the posited SegWit attack may not occur until later this year or even later than that, is that there’s no urgency for ETH/BTC to breakout above its bullish wedge:
(click to embiggen)
Litecoin Look Out Below
LTC/BTC looks very scary! Unlike for ETH/BTC all of LTC/BTC’s moving averages have turned downward! The next support I can find is ~0.00325:
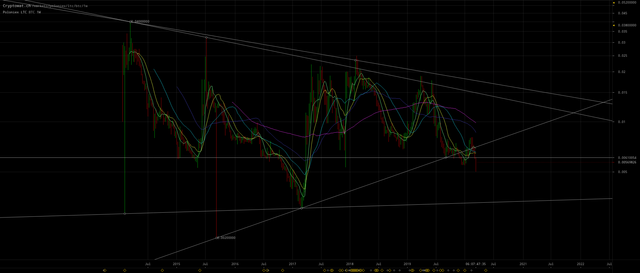
(click to embiggen)
Or maybe it’s just a head fake falling out of it’s wedge and will rise back into it? Doubt it.
I suppose at this juncture becoming clear that Litecoin has no utility nor raison d'être.
Does this mean ETH/BTC will also decline and fall out the bottom of its wedge?
Or maybe we just don’t have the complete data for Litecoin’s history including spike lows and maybe there is a wedge support line down near where the bottom currently is? I doubt it. Litecoin seems to dump very low and then comes on strong as the Bitcoin price rises above former ATH, c.f. early 2017 for example.
UPDATE 42 Hours Later
One possible reason for the excessive dump is PlusToken scammers who had accumulated 200,000 BTC may be dumping them to drive the price down and accumulate moar Bitcoins with leveraged shorts/longs as they yoyo the markets.
They will continue only until they have taken all the BTC they can from the weak hands, unless they have a different objective such as initiating the SegWit donations attack now.
Traders are apparently already arbitraging the situation selling on bounces and buying on dips as well as arbitraging ETH/BTC which is driving ETH/BTC higher because it’s the smaller market cap. So the manipulators may be rapidly losing incentive to continue their attack?
Where’s the Bottom?
The price flash crashing to to ~29% below the $5.5k 200 DMA would be nothing new to Bitcoin:
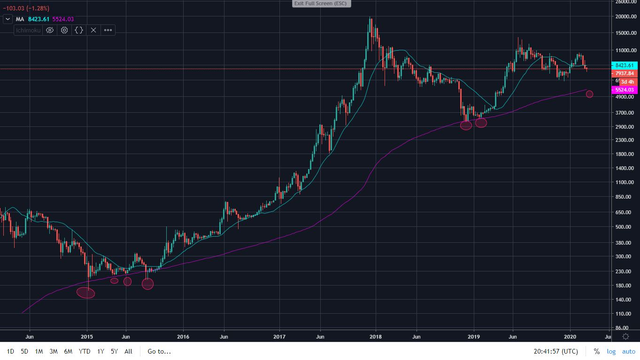
(click to embiggen and read more)
So 0.71 × $5524= ~$3922. Hmm. Maybe the bottom is already in:
“volume spike we need to seal the bottom of the bear market”
Here’s some scenarios I quickly sketched:
(click to embiggen: “If bottom is $4k.”)

(click to embiggen: “If bottom will be $3.1k”)
(click to embiggen: “If bottom will be $2.2k in massive bull flag channel.”)
Filbfilb Citing Possible 61.8% Retracement
(click to embiggen and read discussion)
“that is absolutely textbook AB=CD with the 61.8 retract to the 10k.”
If 61.8% is the correct hypothesis, $10.5k × 0.382 = $4k confirms bottom is already in.
Also the Cost of Production (CoP) model was signaling this decline:
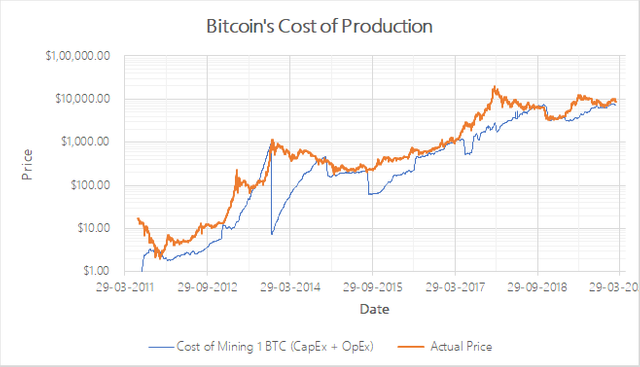
Bitcoin’s Cost of Production — A Model for Bitcoin Valuation
Essentially the CoP model predicts that more efficient mining hardware drives up the CoP for the weighted average miner.
Note the metrics and methodology employed to make the chart above are inexact and don’t account for all possibilities and exogenous reasons — for a precipitous decline in the CoP — such as my posited Precisely Why Bitcoin Is Re-accelerating.
I commented on the CoP blog as follows (but note Medium has censored all my posts, lol):
Excellent, but ostensibly the reason your model isn’t predicting the peak highs and also the reason it didn’t predict the current spike low to$4k is because you haven’t factored the CoP of the marginal miner into your analysis, c.f. also section Naive S/F Model Neglects Transaction Fees. Thus you have missed the causal correlation that ratchets the price higher. Your regression fit gives you a predictive fit but doesn’t explain the causative economics. Let me help you on that.
I wrote the following on my recent blog Bitcoin’s Pivotal, Religious Moment of Transformative Truth Has Likely Arrived (Tomorrow) in the section “Filbfilb Citing Possible 61.8% Retracement”:Note according to Economics 101 the price of Bitcoin (where supply and demand curves meet) — would be set by the CoP of the highest cost marginal miner — which would be higher than a price based on the weighted average miner CoP but also subject to more precipitous drops when for example Bitmain S9s are taken offline during a price drop (which I have confirmed is happening in a panic). When the price rose above ~$
8.5kthe S9s became profitable in January, but then the hashrate moved up considerably because of all the S17s and s19s coming out of production. Also recently Whatsminer is ramping up massive production of efficient miners via Samsung’s fab to compete with Bitmain and TMSC. So the price moved up to where any drop in the price would render S9s uneconomic. So then it was a self-feeding spiral in CoP down to$4kwherein the S9s are very much profitable again. If the price can accelerate upwards, the S9s remain profitable. This plunge is the SLINGSHOT to gather the energy for my posited moonshot price rise.Hope you write a second blog and incorporate my suggestion. This is your baby, I prefer for you to get the credit for it. Please just mention I made a suggestion.
That means the author of the CoP blog will never be able to read what I wrote.
See also the originator of the energy model which CoP derives from:
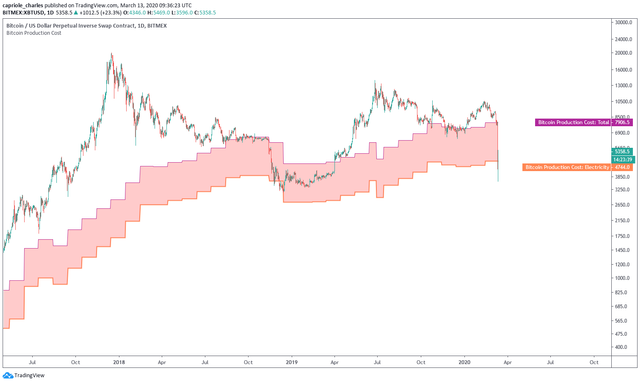
(click to embiggen and read discussion)
miners now unprofitable.
Bitcoin Electricity Cost tested, this is the point where miners start to turn off rigs, b/c the electricity bill is more than 1BTC.
These conditions don't last long.
Expect we hold (mostly) above $5000, and then start to see Hash Rate drop.
I replied to the above tweet:

I blogged 10 months ago in Secrets of Bitcoin’s Dystopian Valuation Model:
“Unforgeable Costliness” in the S/F Model
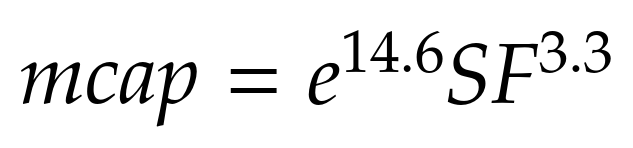
@PlanB’s stock-to-flows (S/F) model stocks market capitalization valuation equation is driven solely by the opportunity cost to produce (aka mine) new units of the monetary resource — otherwise the resource is not monetary. The S/F model predicts the market capitalization will increase
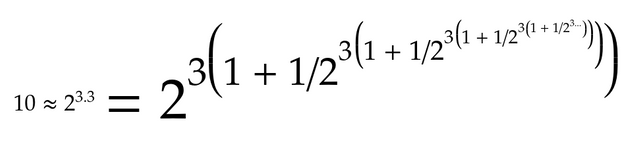
≈10Xfor every halving of the annual production of the resource:Why
10Xincrease for only a doubling of the S/F ratio? I visualized this quantitatively on a Matryoshka doll manifold of three fractal, recursive, relativistic dimensions:The base
3orthogonal factors of2(i.e.2 × 2 × 2 = 2³) are due to following increases in opportunity cost (i.e. time has a cost):
- Doubling of the cost to produce a proportional unit of the stock.
- Doubling of the time to produce a proportional unit of the stock.
- Doubling of the time to debase the stock.
I posit these combine to produce a commensurate increase in energy consumption every 4 years, depending on whether energy remains a constant proportion of mining costs.
https://digiconomist.net/bitcoin-electricity-consumption
Each factor is an orthogonal dimension because each contributes to valuation. For example, although flow and stock determine both of that latter two factors, each factor independently contributes to valuation. Increased stock is an increased mass and inertia for public confidence
[…]
Remember from Economics 101 that supply and demand curves meet at the price of the marginal (i.e. highest cost) producer.
[…]
Thus given that all fungible resources are power-law distributed, the hashrate-weighted work costs of the miners are presumably power-law distributed. Thus a protocol-dictated halving of the flow which is the miner’s reward, only causes a negligible fraction of the systemic hashrate to stop mining at the same valuation, i.e. the work applied to mining is nearly inelastic to income greater than or equal to half of the marginal cost of production. The ≈4 years between halvings allows for two doublings of Moore’s law for the electrical efficiency of the ASIC mining hardware, so that cost of production for most of the systemic hashrate is much lower than the marginal miners.
Thus after the halving the systemic hashrate (but not the work) being applied per (non-proportional) unit of production is nearly double (at the same valuation). The halving of the flow (i.e. a doubling in time cost in two orthogonal dimensions) along with this doubling of cost per minted token causes the valuation to increase by a factor of
10. The increase in valuation restores the profitability of some of the marginal miners which would have been lost by the halving. The key here is that the work applied recovers (as efficiency of mining hardware is improved) at the new level of electrical efficiency after the halving. Since systemic hashrate (or analogously mining difficulty) is a directional proxy for the work that will be consumed, the halving doesn’t cause any reduction in “work” for valuation.
Filbfilb Implicitly Predicted in 2017 My Coming Moonshot Hypothesis
In 2017, Filbfilb predicted the rise to $20k and the decline to $4k:
(click to embiggen and read discussion)
(click to embiggen and read discussion)
Click here for the live version of that prediction.
Unwittingly Filbfilb also implicitly predicted is my posited upcoming moonshot Bitcoin Death Spiral Underway — or Something Else?:
I’m expecting the superimposition of a tweening of a prior fractal similar visually to the following:
(click to embiggen)
The $20k ATH corresponded to just the first ~$220 peak in 2013, the final $1200 high came late in 2013. The final high is yet to come for this current fractal pattern. Note that spike down in 2013, before the moonshot vertical rise into the end of 2013!
Disclaimer: This is for your entertainment, not financial planning nor legal advice. Consult your own professional (perhaps licensed) adviser. I’m not responsible for any decisions you make after reading this post.
Very interesting!
Tomorrow we will know more
Ill mail you as soon as I made some good trades.. ^^
@tipu curate
Posted using Partiko Android
Upvoted 👌 (Mana: 0/3 - need recharge?)