Bitcoin’s Fractal Acceleration Entire History
Visually the entire history of Bitcoin has compelling evidence of my posited expectations for fractal acceleration:
shelby3 published on TradingView.com, February 29, 2020
Click here to view the live version of the above chart.
That updates a chart from my blog Bitcoin’s Whiplash Bear Trap 3 months ago:
Tangentially note, Bitcoin ended up bottoming in December 2019 exactly according to my prediction from that blog:
so a higher target such as
$6.35kis also possible:
[…]
Filb Filb is probably correct that the miners defended
$3.17kbefore as their cost of production. And they will defend$6.35kthis time because their cost of production will be doubled at the halving of the mining reward as of May 2020.
Also tangentially note in my blog Upwards Bitcoin Price Acceleration Imminent that Bitcoin and the altcoins are ostensibly again bottoming again exactly per my recent predictions:
Major Update February 27, 2020
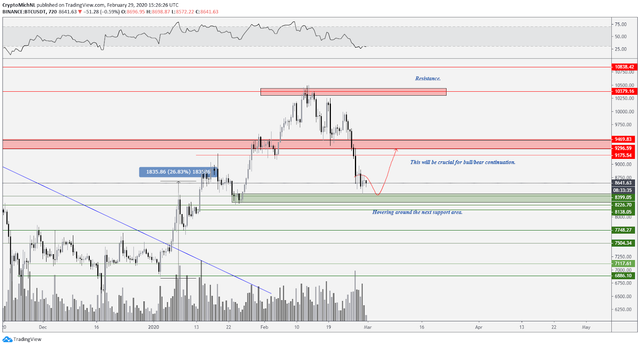
Now there’s clarity as the scenario from my blog 13 days ago Bitcoin Movements Ahead on the Way to the Moon has come to fruition:
[…]
Roughly looks like after peaking
$10.5kto$11.5kthen a decline into late February or start of March to between$8.4kto$8.8kat roughly the 100 or 200 DMA, although bear in mind the confluence$9,550zone mentioned below — which might serve as support on the downside.And the
~1.25Xvertical acceleration of this cup compared to the one in 2019, is portending a spike to between$13.8kand$15.3kprobably in early to mid-March.The repeating fractal pattern portends another spike to ~
$22klater in April. And then in the middle of May a blow-off peak of~$35kalthough the spikes could be progressively higher because acceleration is a non-linear projection.
(click to zoom)
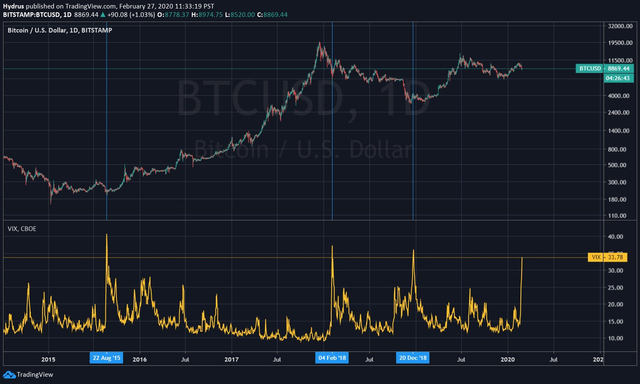
spikes in the VIX correlate (spurious?) with Bitcoin bottoms
Bitcoin Price Falls $1,400 in One Week — Is the Bear Market Back?
Rebuking Regurgitated Doomsday F.U.D.
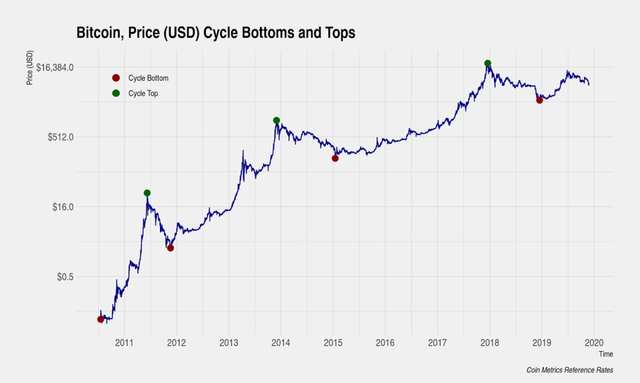
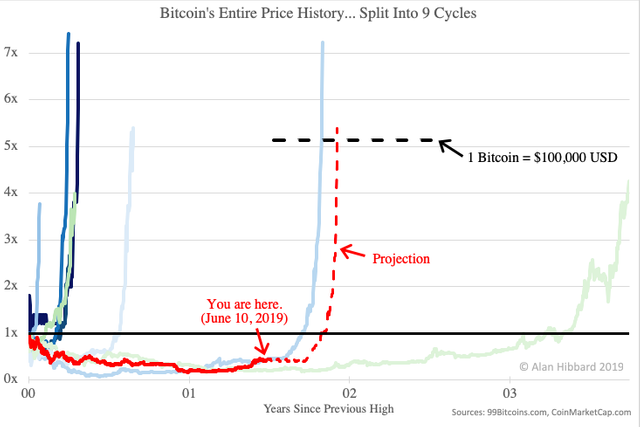
I decided to share my findings in this blog after reviewing my hypothesis to debunk the F.U.D. of the following chart:
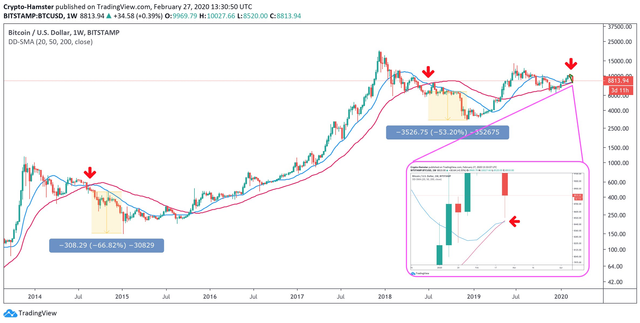
Bitcoin Fractal Indicates a Massive Price Crash to Below $3,000
One can imagine an enlarging fractal pattern on the chart above, wherein the decline from the ATH at end of 2017 to the third, red, down arrow (⇩) corresponds to the decline from the 2013 peak to first, red, down arrow.
That fractal correlation would be a decline to $1000 over the next 15 to 36 months!
However, in addition to the turning up of the 20 WMA (isn’t currently declining, thus won't go very far under nor stay under the 50 WMA very long if the Bitcoin price increases soon), the bullish crosses (50 up over the 100 WMA in December and recently 50 up over the 200 DMA), I had rebuked that sort of idea for a fractal correlation 3 months ago in my Bitcoin’s Whiplash Bear Trap:
I also refuted the more extreme bearish predictions in a comment on my prior blog:
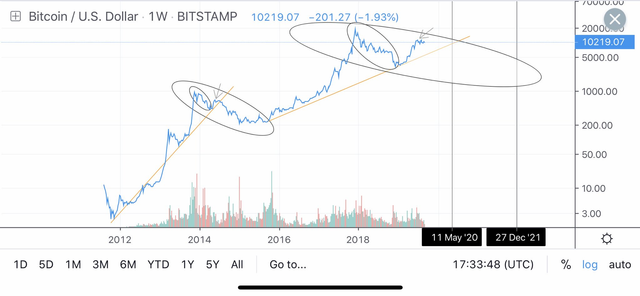
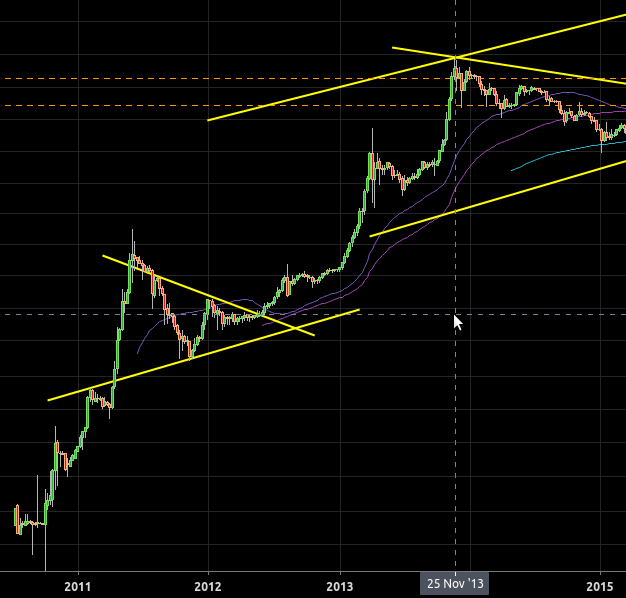
Note though there is a speculation (c.f. also) by Willy-Woo that Bitcoin could crash. Here’s the most extreme idea for a crash to
$1000:
[…]
That extreme idea depicted in the chart above is incongruent with the topological interpretation I posited in this blog of mine. His idea makes no sense because he is presuming topological equivalence between a -30% decline to a -85% decline (at the neckline lows to the left of each of his arrows)!
Fractal Acceleration
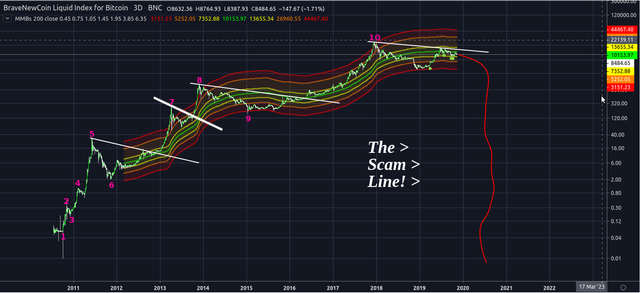
The F.U.D. chart idea above isn’t congruent with the topology I posited in McAfee’s Dick Math: illuminating Bitcoin’s ACCELERATING price:
[…]
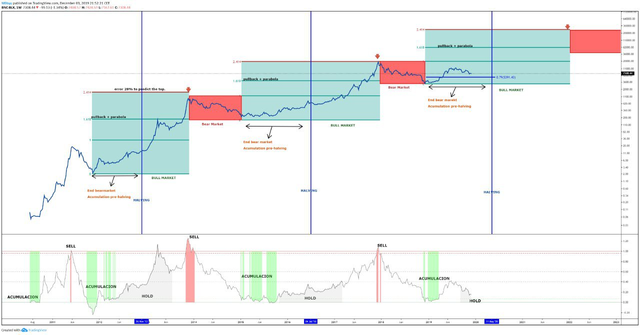
There’s a repeating topological feature or fractal pattern
1→2→3→4→5which repeats as3→5→6→7→8and6→8→9→10→11. Note11has not occurred yet.
So 7→8 should repeat as an enlarged fractal pattern 10→11 (11 is coming) — not repeat as 8→10 as implicitly assumed by the aforementioned F.U.D. chart idea. For 7→8 to repeat as 8→10 would violate both my fundamental reasoning/conjecture and also the fractal nature wherein patterns are complex deterministic chaos — not simplistic, repeating trends (i.e. that most everyone erroneously thinks Bitcoin is decelerating due to maturation of adoption and speculation).
I discussed my fractal acceleration hypothesis previously:
- Bitcoin Fractal Projects an Infinite Price 9 days ago
- “UPDATE Feb 17, 2020” in Bitcoin Movements Ahead on the Way to the Moon 12 days ago
- McAfee’s Dick Math: illuminating Bitcoin’s ACCELERATING price 3 months ago
- comment on blog Most Important Bitcoin Chart Ever 10 months ago
And discussed fundamental reasons for this acceleration:
- Legacy Bitcoin Rises Surreptitiously as the Reserve in a new Two-tier Monetary System; whilst impostor Bitcoin Core Dies 7 days ago
- Armstrong Confirms Bitcoin Bull Market; Warns Dacronian Capital Controls 7 days ago
- Legacy Bitcoin to radically outperform gold a month ago
- Precisely Why Bitcoin Is Re-accelerating 3 months ago
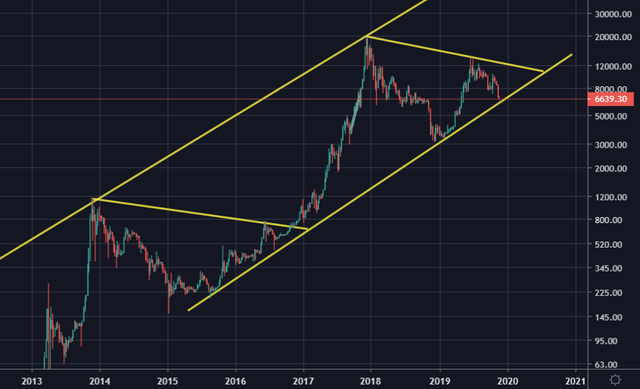
Let’s tie this into the entire Bitcoin price history:
shelby3 published on TradingView.com, February 29, 2020
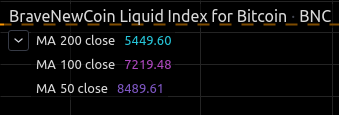
The weekly moving averages (WMA):
Bitcoin rocket launch imminent
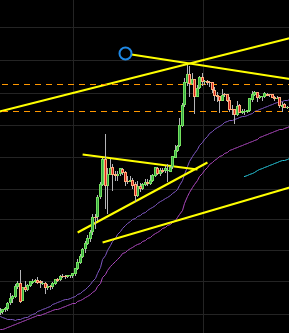
I annotated the chart above to compare the bullish wedge from the prior bull market to the current one underway. Note above I have argued that the prior bull market 8→10 doesn’t topologically correlate to the current one 10→11 underway, so I’ll factor that into the analyses below.
The white, horizontal dashed line is my posited bottom for this current correction before moving back up to the top of the bullish wedge and probably rocketing up from there.
The thin brown, horizontal, dashed lines are the posited breakout from top of wedge and projected rise, as correlated to the prior bull market.
Note the duration of the current bull market underway is ~0.8X to 0.9X the duration of the prior bull market, measured and computed by comparing the relative duration from the peak to the bottom(s) of the decline and/or the first significant peak from the bottoms. Thus the aforementioned breakout (i.e. above the top of the bullish wedge) is posited to occur between January and April — mostly likely March.
Additionally the amplitude of the current bull market underway is ~1.5X that of the prior bull market. Thus the thick brown, dashed lines are the posited price levels if this amplitude, amplification adjustment factor is applied.
The lowest thick brown, horizontal, dashed line $30k correlates to the June 2016 peak. The highest thick brown, horizontal, dashed line $760k correlates to the 10 peak. With this amplification, the highest price from near the end of 2016 projects to a ~$46k price in the current bull market underway (note I did not annotate this $46k horizontal line). With just the linear, time acceleration-correlation assumptions above, those project to occur roughly May 2020, Q2 2021 and Q3 2020 respectively.
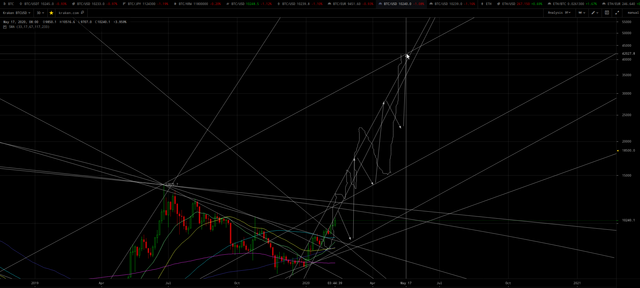
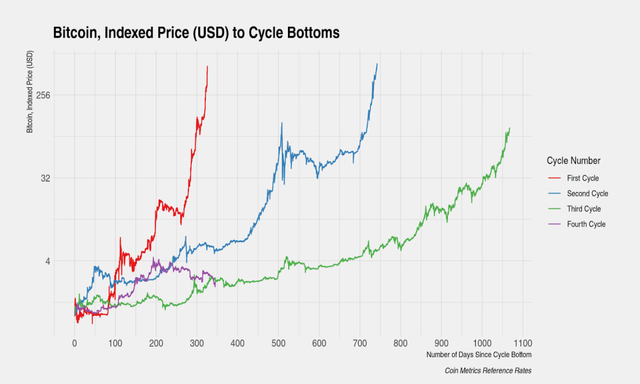
However, Bitcoin isn’t linearly accelerating (nor linearly decelerating if you prefer that erroneous interpretation) and I’ve posited that 10→11 correlates topologically (and a fractal pattern match) to 7→8. And note the spike down right before the rocket to the moon:
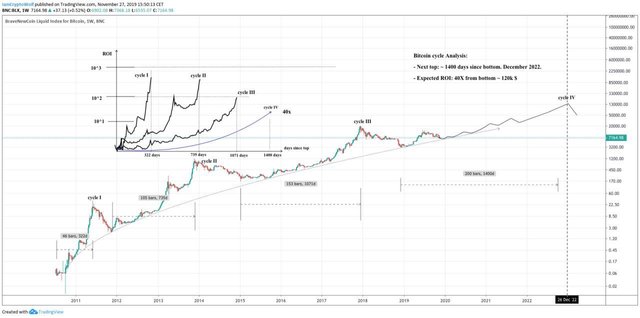
Current bull market underway is 27 ÷ 6 months = 4.5X longer in duration. Presuming current bull market breakout over $11.5k in March 2020, this correlation projects to ~$24k–$36k before May 14 and ~$359k by November 2020.
But these topological and fractal correlations are not isomorphic, homomorphisms. There’s a complex deterministic chaos, and we’ve previously posited (c.f. also) that facets of the 5→6→7→8 pattern will also factor into the outcome of the current bull market underway:
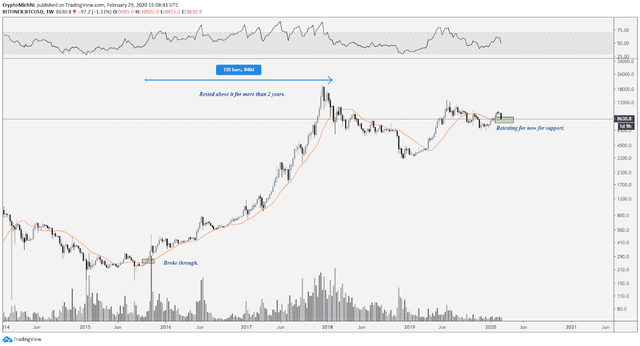
More bullish analysis which was also conceptually included in a more detailed analysis I posted in mid-November (almost two weeks ago):
(click to zoom to source)
(click to zoom to source)
(click to zoom to source)Due to the “tweening” I explained in my linked analysis and factoring in the last chart above, there should be an initial new ATH at
2.414Xgreater than the prior ATH (i.e. thus2.414 × $19.7k = $47.5k) before the May 2020 halving.
Dr. Albert Bartlett stated, “The greatest shortcoming of the human race is our inability to understand the exponential function.”
Imagine a caretaker that comes to check on his lily pond once a month. It requires 36 visits (i.e. months) for the pond to be completely covered with lily pads. But on the 35th visit the pond is only half covered. If not thinking in terms of exponential math, the typical human caretaker’s linear extrapolating, visual mind will be fooled into thinking there’s 35 more visits after the 35th visit before the pond will be fully covered.
The 8 peak for that 5→6→7→8 projects to $2.5 million and it could occur much sooner than a simple, linear estimate of May 2023:
Fundamental Reasoning/Conjecture
Remember my hypothesis is that a confluence of fractal patterns (combined with the fundamental reasons that legacy Bitcoin is being readopted as the impostor Core softfork will soon be kicked off of Bitcoin) means the acceleration prior to $31 peak in June 2011 will be repeating.
So that to-da-moon rocket to $2.5 million could occur by late 2020 or within 2021. Whereas, longer-term Bitcoin Fractal Projects an Infinite Price as the U.S. dollar loses its reserve preference after 2032 or 2036.
Let’s look at the entire history chart again:
shelby3 published on TradingView.com, February 29, 2020
Before June 2011 there was a stampede to buy Bitcoin while nearly no one knew about it and new early adopters were going bonkers for its future potential.
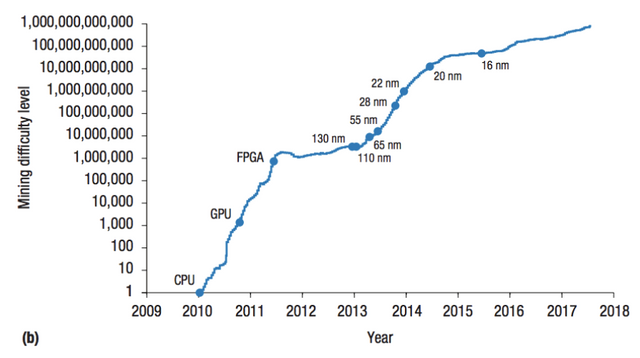
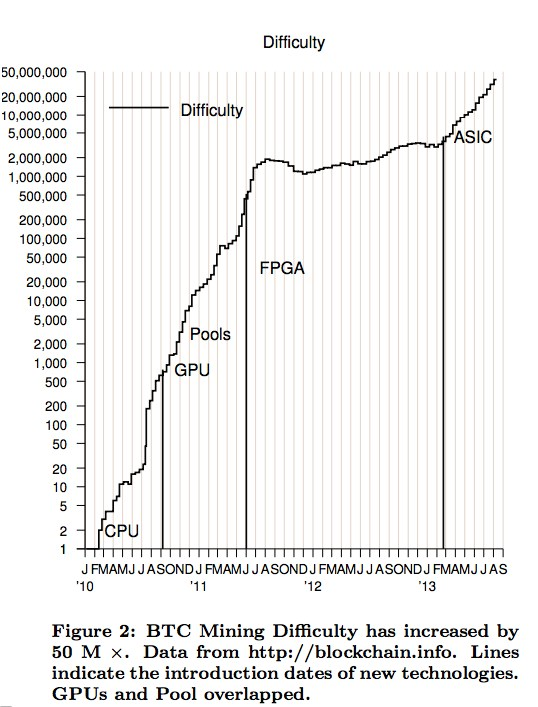
Subsequently the long hangover waiting for some new reason to rush into Bitcoin. In 2013 ASICs arrived for mining and and so the increase in difficulty kick-started a rise in the price that domino-ed into FOMO leading to the 2013 peak. Here’s a pertainent excerpt from my blog Precisely Why Bitcoin Is Re-accelerating:
Six months ago I blogged in Secrets of Bitcoin’s Dystopian Valuation Model:
[…]
Uh oh, some of you may now really be contemplating if I’m Satoshi. 😲
So now we know why cryptocurrency scales so much faster to monetary dominance than the 1000s of years that gold required:
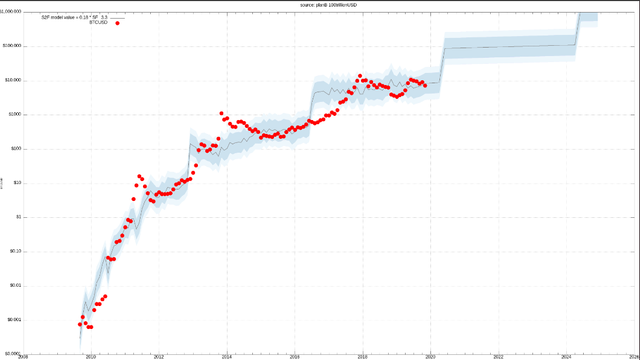
Compare the periods in the charts above to the following chart and note this is the reason the following interpretation is topologically incorrect:
(click to zoom to source)Note that in 2013 which was the corresponding topological juncture as current fractal pattern, the price peaked at 20 times higher than the stock-to-flows model price. So that projects a ~$2 million peak price in 2020/21:
(click to zoom to source)
After 2013 there wasn’t anything to rush into until Ethereum spawned an ICO Tulip mania with the ERC-20 copycoin crap. That FOMO insanity was able to push the Bitcoin price up a nosebleed peak in 2017.
There’s really no reason to rush in now — the general public thinks Bitcoin is a scam and the altcoin greater fools are depleting. That is except for being able to move capital out of the accelerating, global pandemonium:
- Insane Clusterfuck of the Collapse of Rule-of-law, Eventually to Imprison Most Westerners 6 days ago
- Armstrong Confirms Bitcoin Bull Market; Warns Dacronian Capital Controls 7 days ago
- Slinghots to da Moon then Into Abyss of HIV-flu — Revelation’s plague bowl poured out 26 days ago
And the scantly known poison pill that Satoshi put in legacy Bitcoin — the Segwit donations amplification game theory:
- Legacy Bitcoin Rises Surreptitiously as the Reserve in a new Two-tier Monetary System; whilst impostor Bitcoin Core Dies 7 days ago
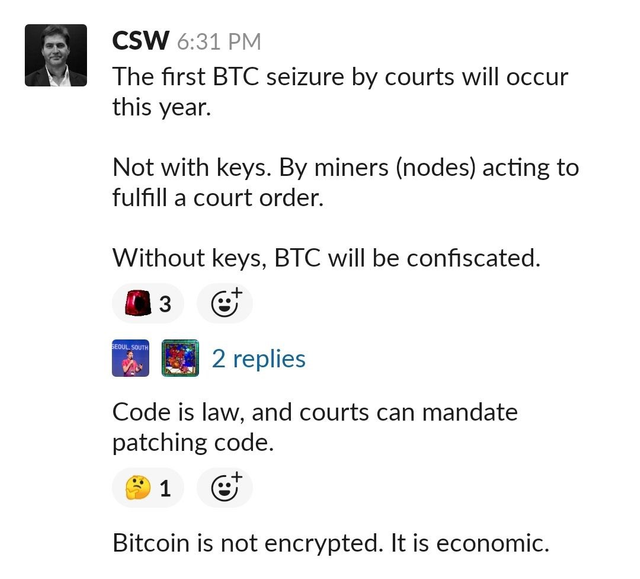
Courts Will Begin Seizing Bitcoin This Year Without Using Private Keys, According to Craig Wright - Legacy Bitcoin to radically outperform gold a month ago
- Precisely Why Bitcoin Is Re-accelerating 3 months ago
And if that hypothesis is correct, the mad rush to obtain much more scarce legacy Bitcoin could recreate the stampede from before June 2011.
shelby3 published on TradingView.com, February 29, 2020
The posited topological, fractal pattern correlates to the following interpretation/analysis of the fundamentals:
| Bull Market | Cause |
|---|---|
| Bitcoin Pizza Day ⇨ 2011 peak | Early adoption Crossing the Chasm FOMO |
| February 2013¹ ⇨ April 2013 peak | First halving, plus ASICs increased mining difficulty/security/value/marginal cost |
| Q4 2013 peak | Geek and hard money realization FOMO |
| May 2016 ⇨ 2017 peak | Second halving, plus altcoin FOMO |
| April 2020 ⇨ ⁇ peak | Third halving, plus SegWit donations will catapult mining difficulty/security/value/marginal cost, along with ultra wealthy hard money adoption |
Thus 2020 will resemble 2013 fractally tweened with the 2010–2011 bull market to-da-moon.
Hey so I used to watch Columbo when I was a child:
¹ The subsequent month I joined the Bitcoin community and blogged Bitcoin: The Digital Kill Switch, c.f. also. Also advised 167 I.Q. Risto Pietilä (c.f. also) to sell silver and buy 10,000 Bitcoins.
Future Demand for Bitcoin is Monetary — Not Transactional
The entire concept of Bitcoin as a transactional coin for the masses was a scam by Core. Was never Satoshi’s intended design.
Future demand for Bitcoin must be monetary in order for the “going for the gold” stock-to-flows model of Bitcoin’s price to remain valid — contrary to the jealousy confirmation bias (because Ethereum due its mutability and centralization can never have monetary demand) in ‘Rationalized Bulls**t’ — Vitalik Buterin Pans Bitcoin Price Forecasts.
Legacy Bitcoin will be much more scarce because the $billionaire (and powers-that-be $trillionaire) whales (behind the curtain) are going to take most of it (and hodl it long-term) as Segwit donations, via a mad rush to mine legacy (as Core’s hashrate plummets with its mining difficulty stuck skyhigh preventing blocks from being created). And tangentially because a significant portion of the private keys for Bitcoin have already been lost, and more may be lost by those who die from the pandemic underway. Additionally the whales will attempt to trade this tainted Bitcoin for untainted coins, before the FATF freezes those tainted coins further reducing the supply. Additionally the skyrocketing demand for a safe haven asset with sufficiently high market capitalization which can be transported surreptitiously.
The ridicule of this blog in the pertinent forum discussion Long term advance notice! is indicative that — Bitcoin’s “go for the gold” monetary adoption stage (only for the uber wealthy because blocksize will be forever immutable at 1 MiB) — was designed to deal with the confirmation-bias, pride, sense-of-self-worth phenomenon “It's easier to fool people than to convince them that they have been fooled.” by enabling men to die impoverished clinging to the ridiculous belief that Bitcoin failed “because” the circus clown, designated-fall-guy Craig Wright was a scam artist who succeeded in destroying Bitcoin (Core), instead of recognizing the absolutely necessary monetary phenomenon poison pill that “Satoshi” (i.e. the globalist powers-that-be) designed into Bitcoin:
I noticed the Shelby's still peddling the same hypothesis...
Still dribbling about ‘legacy’ Bitcoin and now he's even snuck in a quote from everyone's favourite Australian impersonator. He needs to score some fresh goals to give that cred a top up. However I'm not so sure he scored any the first time round either.
Disclaimer: This is for your entertainment, not financial planning nor legal advice. Consult your own professional (perhaps licensed) adviser. I’m not responsible for any decisions you make after reading this post.
very interesting again!
sadly I can't really trade atm and also am not completely happy with my position rn
but I'm in stationary pain therapy for another 3 weeks and have no wifi (am home for the weekend rn :) )
@tipu curate
@tipu curate
Upvoted 👌 (Mana: 0/10 - need recharge?)