Crypto v. Major Stocks YTD Performance (APPL, GOOG, MSFT, FB, AMZN, BTC, ETH, & XRP)
Introduction
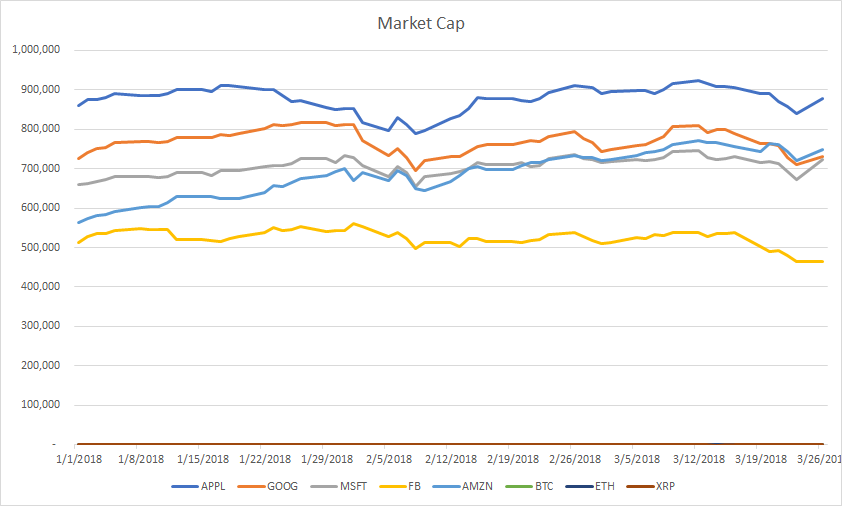
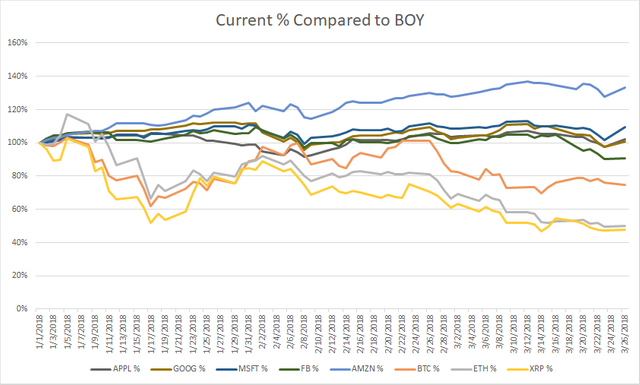
In this post, I wanted to present two graphs. The first graph shows the total market capitalization of the 5 largest companies compared to BTC, ETH & XRP(demonstrating the growth potential and the relatively small market share of the largest cryptocurrencies). The second graph shows the year to date performance of each of the 5 companies and 3 cryptocurrencies (current market cap / market cap as of January 1). As demonstrated by the second graph, the top 5 stocks were significantly more stable and outperformed the crytocurrencies for a majority of the year. This will be another recurring article that tracks the performance of the aforementioned cryptocurrencies.
Market Capitialization
YTD Performance
References
https://www.zacks.com/stock/chart/AAPL/fundamental/market-cap
https://www.zacks.com/stock/chart/GOOG/fundamental/market-cap
https://www.zacks.com/stock/chart/MSFT/fundamental/market-cap
https://www.zacks.com/stock/chart/FB/fundamental/market-cap
https://www.zacks.com/stock/chart/AMZN/fundamental/market-cap
https://coinmarketcap.com/currencies/bitcoin/historical-data/
https://coinmarketcap.com/currencies/ethereum/historical-data/
https://coinmarketcap.com/currencies/ripple/historical-data/
@OriginalWorks
@contentvoter
good graphics and an accurate explanation.
Thanks!