Understanding Bollinger Band + Moving Averages (BBMA Oma Ally)
BBMA consists of the use of 2 indicators:
- Moving Averages
- Bollinger Bands
BBMA consists of 3 types of entries:
- Extreme
- MHV
- Re-Entry
Moving Average Settings
There are 5 MAs used in the system:
2 High Moving Averages Weighted
•MA 5 HIGH (RED)
•MA 10 HIGH (YELLOW)
2 Low Moving Averages Weighted
•MA5 LOW (MAGENTA)
•MA10 LOW (WHITE)
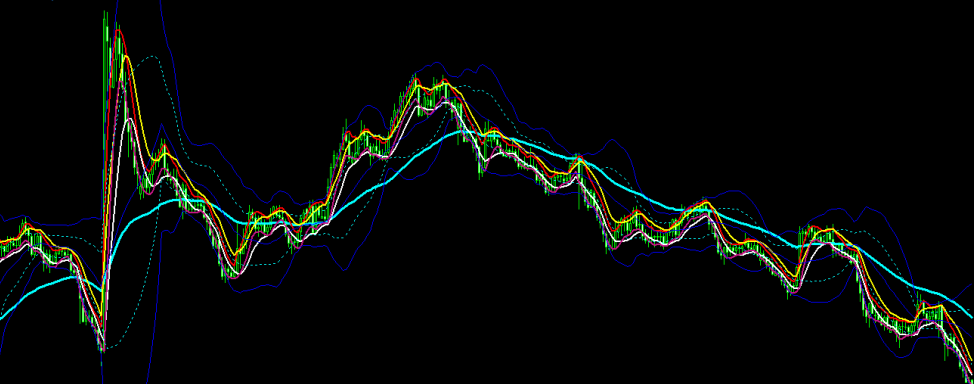
1 Moving Average Exponential
•EXPONENTIAL MA 50 (AQUA)
Bollinger Band Settings:
Period = 20
Shift = 0
Deviations = 2
Apply to = Close
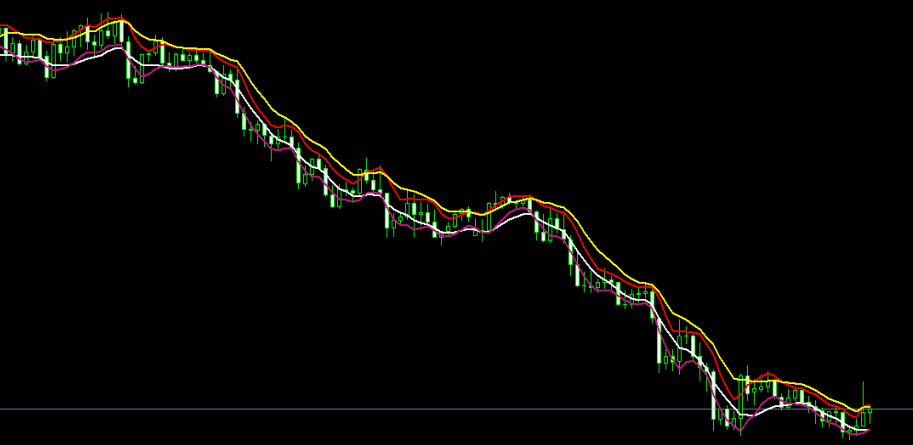
Understanding the Moving Averages:
Downtrend:
MA 5/10 HIGH is above the candles
MA 5/10 LOW goes through the candles
MA 10 HIGH is above MA 5 HIGH
MA 10 LOW is above MA 5 LOW
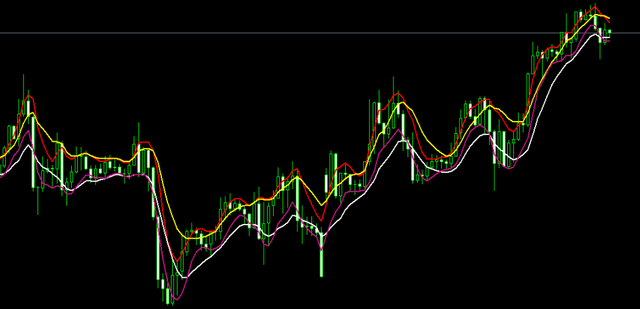
Uptrend:
MA 5/10 LOW is below the candles
MA 5/10 HIGH goes through the candles
MA 5 HIGH is above MA 10 HIGH
MA 5 LOW is above MA 10 LOW
The above MA are only used to help determine trends use the MA50 on a daily
chart to help and get confirmation of the trend. When the market is above the
MA50 price is said to be in an uptrend. When the market is below the MA50
price is said to be in a down trend.
MAs can also act as support and resistance
Understanding Bollinger Bands
Downtrend:
Candles are below the MID BB
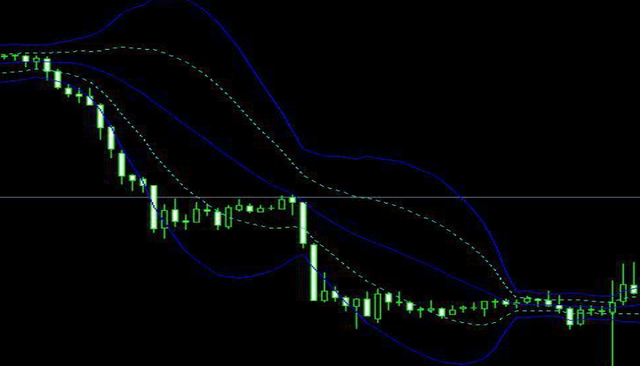
Uptrend:
Candles are above the MID BB
MID BB: MID BB acts as support and resistance as well.
BBMA Entry Types:
- Extreme
- MHV
- Re-Entry
- CS Direction
- CS Momentum
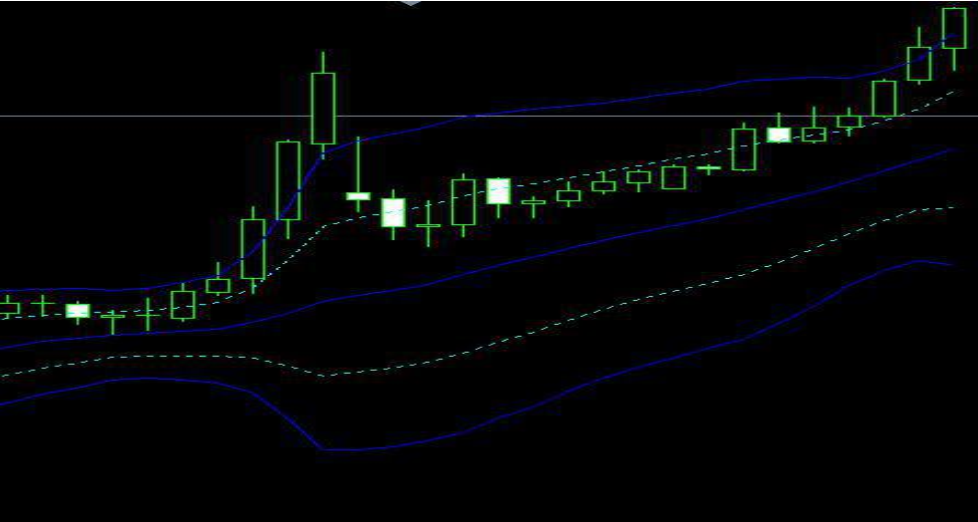
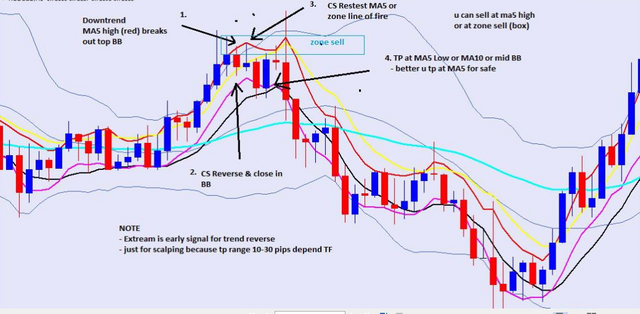
EXTREME SETUP:
Downtrend:
- MA5 HIGH (RED) breaks the TOP BB.
- Candles Stick (CS) reverses and closes within the TOP BB.
- Candle Stick (CS) retests MA5 HIGH (RED) or Zone Line of Fire
(KILLZONE) – this is the ENTRY POINT. - TP at MA5 LOW (MAGENTA) for safety
NOTE: Extreme is an early indication for a trend reversal.
This is a scalping technique, your TP Range is 30-50 pips
depending on the TF. (Always TP as the market direction has not
been confirmed yet).
If CS closes outside the TOP BB then the Extreme is VOID!
Confirm direction when MHV and CS Momentum takes place.
Always back test and confirm on multiple TFs.
SL can be placed a few pips above the Highest Shadow/Wick.
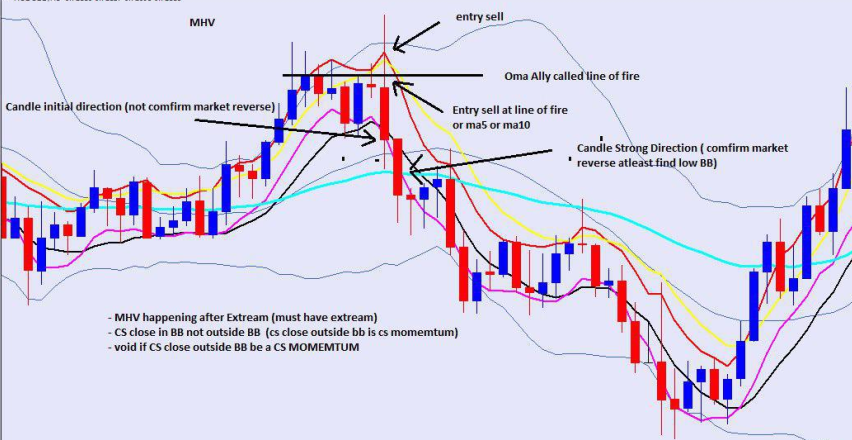
MHV SETUP:
- MHV applies to the end of a trend (Market Reversal) after a rise or fall of
the market. - Occurs when the market weakens and loses momentum to continue either
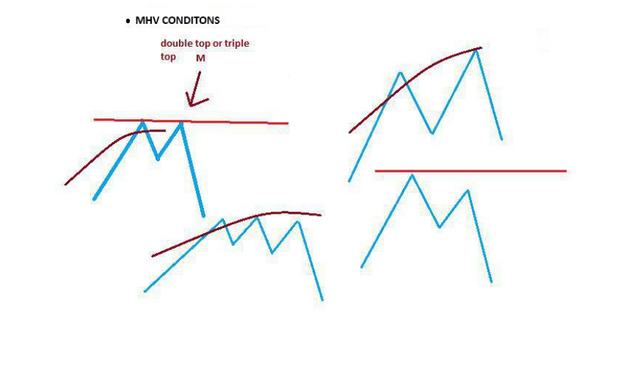
up (uptrend) or down (downtrend). - In some cases MHV can be identified as a double or triple top.
- MHV is formed after an Extreme.
- MHV is valid when: Price failed to break and close outside the TOP
BB/LOW BB - MHV is void when: Price breaks and closes outside of the TOP
BB/LOW BB
MHV Conditions:
RE-ENTRY:
Re-entry is formed after the Rise/Fall of a price or market and the price or
market is now forming a sideways market for a Re-entry.
1
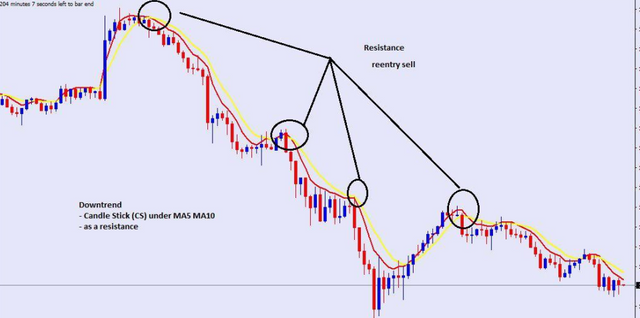
Uptrend – MA5/10 High acts as resistance. Re-enter sell position when
the market finds MA5/10 High. CS are under the MA5/10 High
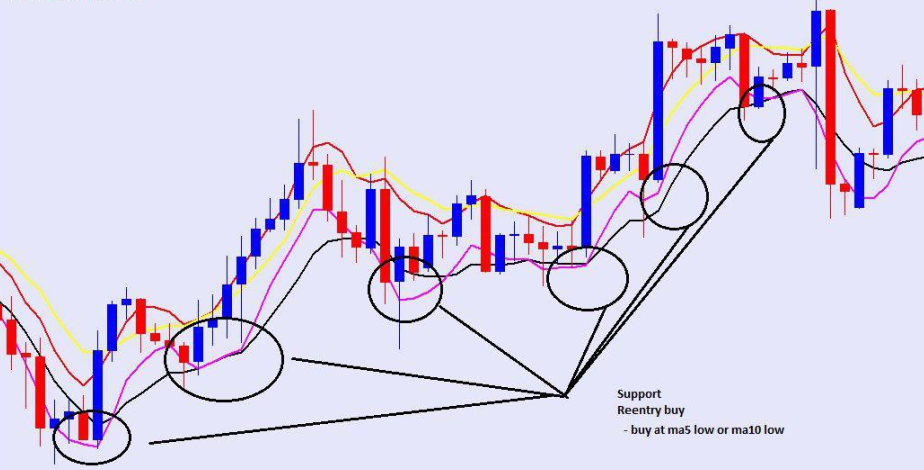
Downtrend – MA5/10 LOW acts as support. Re-enter buy position when
the market finds MA5/10 Low. CS are above the MA5/10 Low
2
- Powerful Re-entry – MA5/10 and MID BB meet or collide.
- Most Powerful Re-entry – MA5/10 MID BB and MA50 meet or collide.
- Re-entry occurs for a minimum of 3 candles per TF. E.g. H1=3 Hours
1D = 3 Days H4= 12 Hours etc
3
- CS Momentum Re-entry – When CS Momentum is formed and CS
reverses to MA5 or MA50 it is indicating a setup for a Re-Entry.
4
- CS Direction Re-entry – When CS direction Confirmed (CSDC) shows,
the market should find the MA5/10 to indicate a Re-Entry. In a
downtrend CSDC will find the MA5/10 Low indicating a Re-Entry Buy.
In an Uptrend CSDC will find the MA5/10 High indicating a Re-Entry
Sell.
Notes:
- Always look at Multiple TFs. E.g. On a H1 TF the candle finds resistance
at the TOP BB, but on H4 TF it indicates a Re-Entry at MA5/10 High. On
H1 CS Direction Confirmed (CSDC) shows and finds resistance at TOP
BB, but on H4 the candle is showing Re-Entry at MA5/10 High. - Always confirm the trend on MA50 on the Daily Chart.
- If the market breaks the MA50 it indicates a trend reversal.
- If the market fails to break the MA50 it indicates a trend continuation.
- MA50 acts as support and resistance.
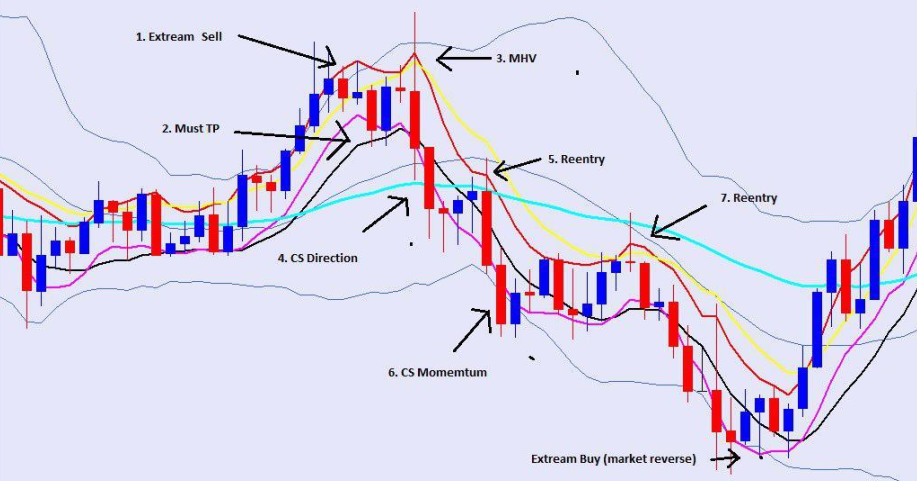
The BBMA Cycle:
Extreme Must TP MHV Candle Direction Re-entry
Candle Stick Momentum Re-entry
Congratulations @akb47! You have completed some achievement on Steemit and have been rewarded with new badge(s) :
Click on any badge to view your own Board of Honor on SteemitBoard.
For more information about SteemitBoard, click here
If you no longer want to receive notifications, reply to this comment with the word
STOP