Analysis Team
We are always on the lookout to buy cryptocurrencies that are likely to change their trend from down to up. We look for basing formations and a subsequent breakout to enter the trade. The longer the basing pattern, the stronger is the resulting breakout.
One such cryptocurrency that looks to have bottomed out and is on its way up is BTSBTC. Let’s look at the critical levels and the reasons why we like it.
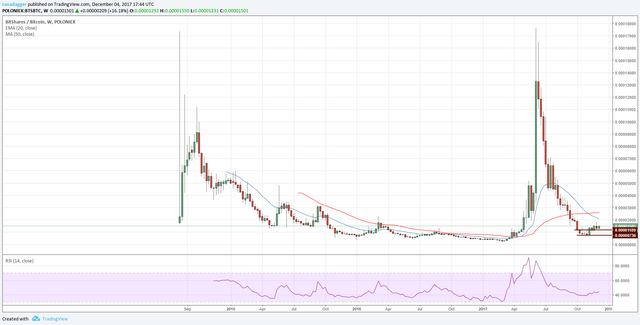
The chart of BTSBTC shows two peaks, one in August 2014 and another in June 2017. Both these peaks formed above 0.000174 levels. Both the rally and the subsequent fall were vertical. While the June peak hit a high of 0.00017642, the subsequent decline plunged the cryptocurrency to a low of 0.00000695 on November 03. That is a fall of 96%. However, we believe that the fall has ended and BTSBTC is likely to start a new uptrend. Let’s look at its entry and exit levels.
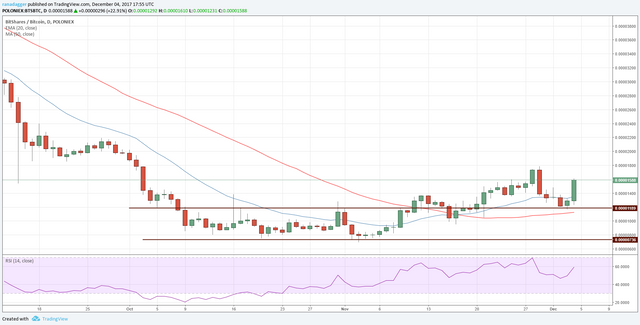
The digital currency remained in a range between 0.00000736 and 0.00001189 for more than a month. While the first attempt to breakout could not sustain above the upper end of the range in mid-November, the virtual currency again broke out of the range on November 20. Thereafter, it completed a retest of the breakout levels on December 03.
The bulls have pushed the digital currency higher following the successful retest. We also like the bullish crossover of the moving averages. As a result of these developments, we believe that a quick rally to 0.000022 is likely, where it may face some resistance. However, if the bulls manage to breakout of this level, a rally to 0.000030 is also possible.
Therefore, we recommend initiating a long position at the current levels of 0.000016 and on dips to 0.000014 levels. The stop loss for the trade can be kept at 0.000011.
Traders can book 50% profits at 0.000022 and trail the remaining position for the higher target of 0.00003.
Reference :
- https://hacked.com/trade-recommendation-zcash-11/
- Crypto Signal
- CryptzSignals