BITCOIN PRICE ANALYSIS: BTC/USD REMAINS AT RISK OF MORE LOSSES
Key Takeaways
Bitcoin price struggled to move above the $9,200 level and declined against the US Dollar.
There was a break below a major ascending channel with support at $8,900 on the 2-hours chart of the BTC/USD pair.
The pair is currently holding the $8,400 support and the 100 simple moving average (2-hours).
BITCOIN PRICE CHART ANALYSIS
There was a decent upside move above $8,500 earlier this week in bitcoin price against the US Dollar. The BTC/USD pair even traded above the $9,000 resistance level.
However, the pair could not gain momentum above the $9,180 and $9,200 resistance levels. A high was formed at $9,182 before the price started a downside correction. It moved down and broke the 23.6% Fib retracement level of the last wave from the $7,242 low to $9,182 high.
Bitcoin Price Analysis BTC USD
It opened the doors for more losses and pushed the price below $8,800. More importantly, there was a break below a major ascending channel with support at $8,900 on the 2-hours chart of the BTC/USD pair.
The pair is currently trading near the $8,400 support and the 100 simple moving average (2-hours). The $8,400 and $8,350 levels are important supports. Below $8,350, the price may even test the 50% Fib retracement level of the last wave from the $7,242 low to $9,182 high at $8,212.
If the price fails to hold even $8,212, then there could be a test of the $8,000 handle. At the moment, it seems like the 100 SMA holds the key at $8,400. As long as the price is above $8,400, it may perhaps move higher.
On the upside, an initial resistance is around the $8,800 level. Once there is a proper close above the $8,800 level, bitcoin price may resume its upside. The next major resistance levels on the upside are at $9,000 and $9,200.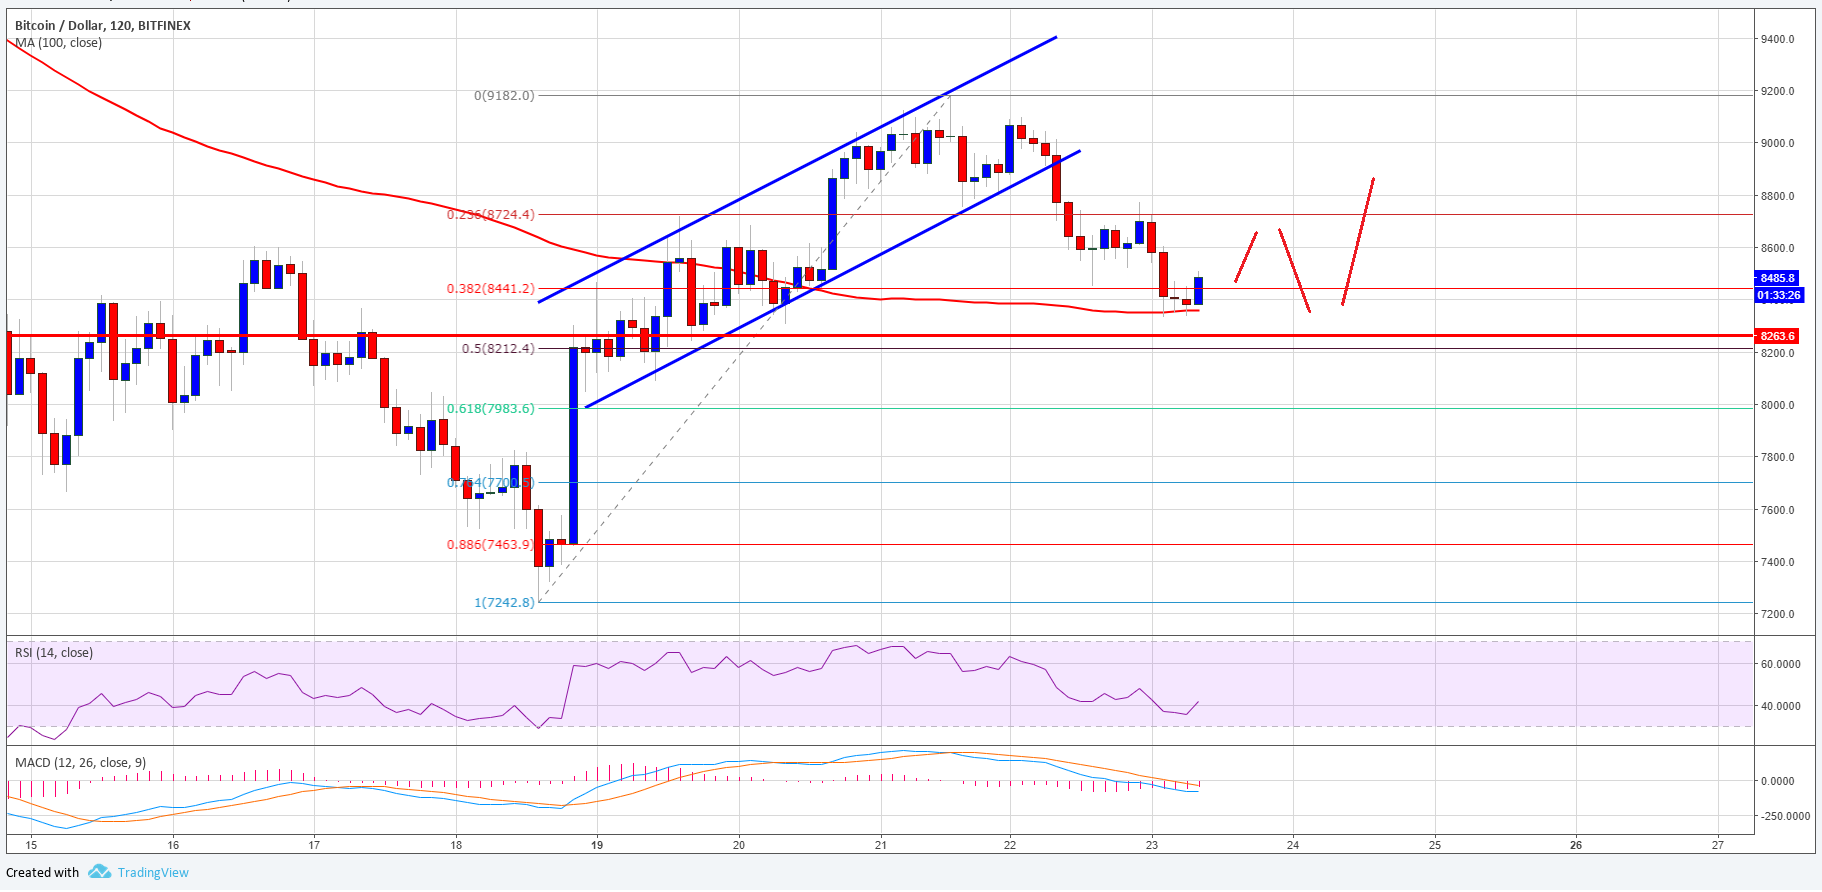
good
thanks
For future viewers: price of bitcoin at the moment of posting is 8404.10USD