Gold Sets Up For Massive Move Higher
Our research team believes the recent downward price activity in gold and silver are indicative of past price patterns we saw in gold during the 2007 to 2012 rally. Throughout almost every rally in precious metals (gold), there have been a number of moderate to serious price corrections taking place within that extended rally. The current downside move is moderately small compared to historical price rotation in gold and potentially sets up a massive upside rally to levels above $2100 per ounce.
The chart below highlights the downside price rotation that took place just before and as the U.S. stock market collapsed in late 2008 and 2009. Notice how gold lost nearly 28% right as extreme market weakness began to become present in U.S. stocks. Then pay attention to how gold rallied from $730 in multiple upside price legs to a peak just below $1900 – well above 110%. Could the same pattern already be setting up in 2020?
Weekly Gold Price Pattern From 2007 - 2017 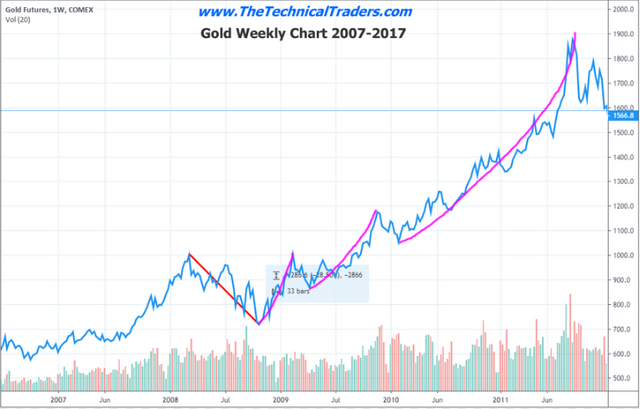 Weekly Gold Price Pattern From 2007 - 2017
WEEKLY GOLD CHART TREND IS CLEARLY UP
The current gold chart above highlights what we believe is a similar price pattern when gold collapsed as the downturn in the U.S. stock market took place between October 2018 and December 2018. Subsequently, gold then rallied to levels nearing the previous peak level (near $1380), then rallied even further to $1540. We believe the current downside price rotation is similar to the downside price rotation that took place in August/Sept 2010 – just before gold went from $1050 to $1890 (+85%). If a similar type of rally were to take place from the current $1587 lows, gold's peak price may be near $2935.
Weekly Gold Price Pattern From 2015 - 2020 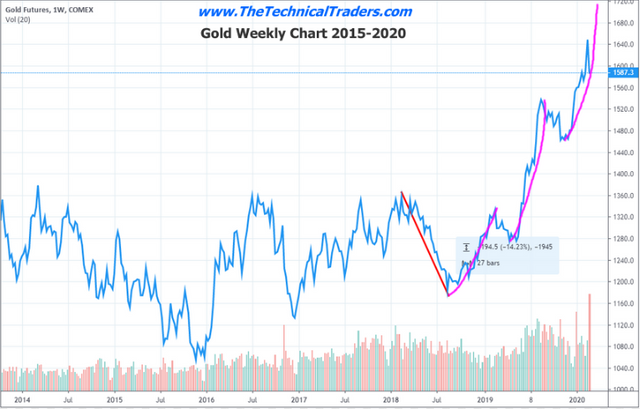 Weekly Gold Price Pattern From 2015 - 2020
GOLD/SILVER RATIO SCREAMS BARGAIN
This last chart shows the true potential for a silver rally based on historical levels of the gold-to-silver ratio. There has never been a time since 1990 that the ratio has been this high (93.9). Historically, traditional levels are closer to 74-76. If gold rallies above $2100 and the gold-to-silver ratio contracts to the historical 74 to 76 level, silver will likely rally to levels above $40 to $50 per ounce. If gold rallies to our projected peak level of $2935 and the ratio reverts, silver could go to levels well above $65 per ounce.
Weekly Gold/Silver Ratio 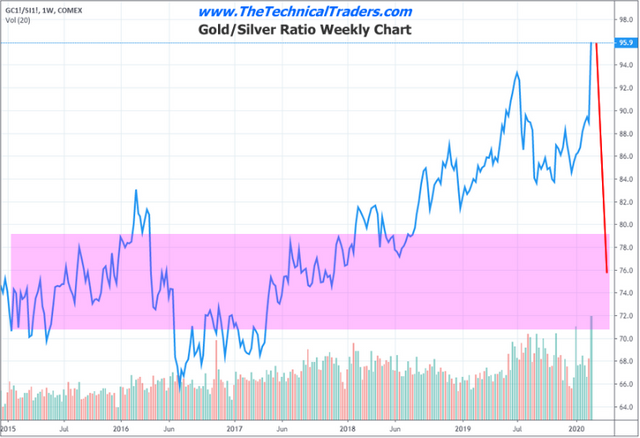 Weekly Gold/Silver Ratio
This downside move in both gold and silver is an incredible opportunity for skilled traders. Don't miss the opportunity to get into a precious metals position near these levels – before the real rally begins.