Gold Fails As A Safe Haven Amid Coronavirus Panic
The S&P 500 was down 14.4% for the week at one point Friday on fears the coronavirus outbreak is going to become a worldwide pandemic. It is common knowledge that investors turn to gold when stocks and other risky assets decline. Last week, however, that wasn’t the case.
While stock markets around the globe were plunging, the price of gold fell, too. The yellow metal dropped from a 7-year high of $1689 to as low as $1563. In other words, the best safe-haven lost 7.5% just when investors needed it most.
Popular financial media attributes gold’s decline to profit-taking from traders. Had gold been rising, they could’ve just as easily explained it with the coronavirus. Instead of looking for after-the-fact explanations, we sent the following chart of gold to subscribers before the open on February 24th. It shows that if one looks at it from an Elliott Wave perspective, gold’s weakness wasn’t that surprising.
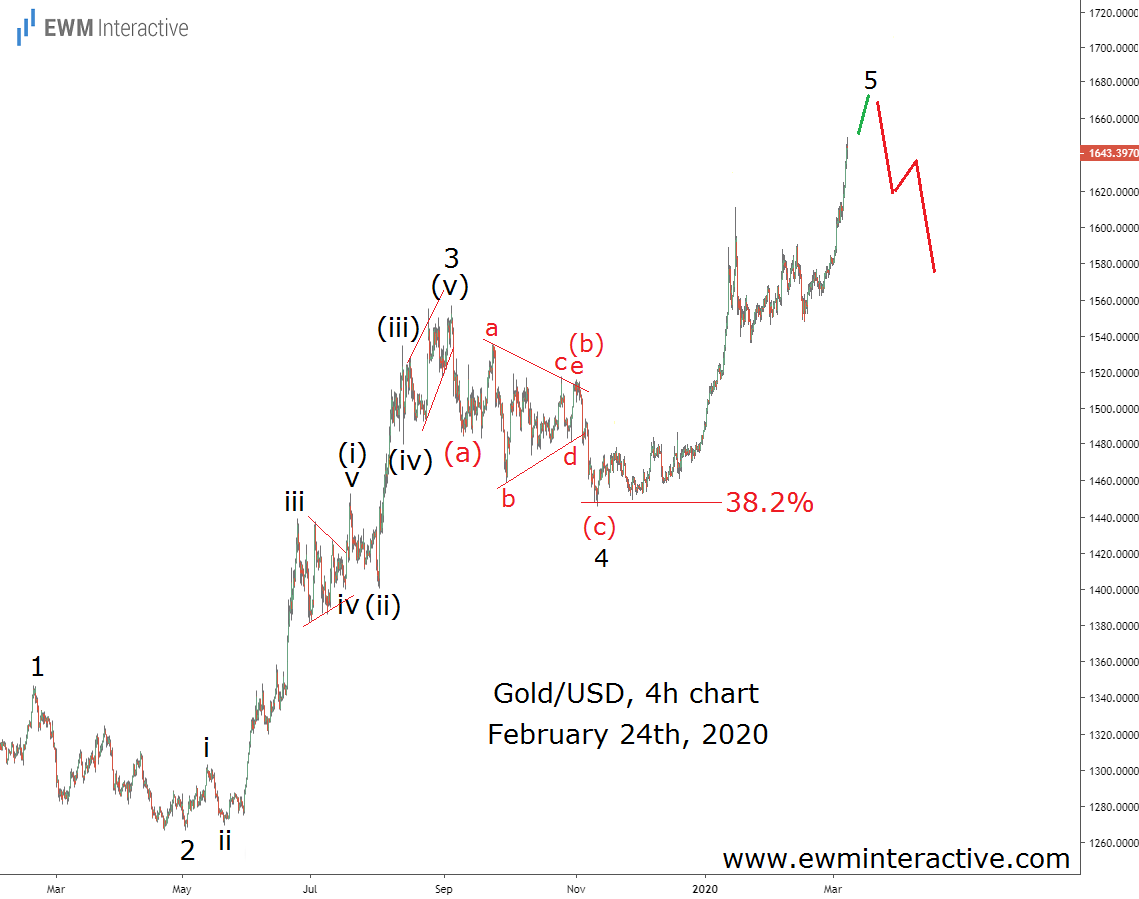
Gold’s 4-hour chart reveals what we believed was waves 2, 3, 4 and 5 of a five-wave impulse. According to the theory, a correction follows every impulse pattern. So, instead of joining the bulls near $1640, we thought “long positions should be avoided, despite all the fundamental reasons to be bullish“.
And the list of fundamental reasons to be bullish on gold as a safe haven asset was a long one:
- The coronavirus
- Slow economic growth
- Rising tensions in Syria
- Continued easing by the Fed
- The inverted yield curve signaling a possible recession ahead
- You name it…
Yet, gold ignored everything and fell anyway. Take a look at the updated chart below for reference.
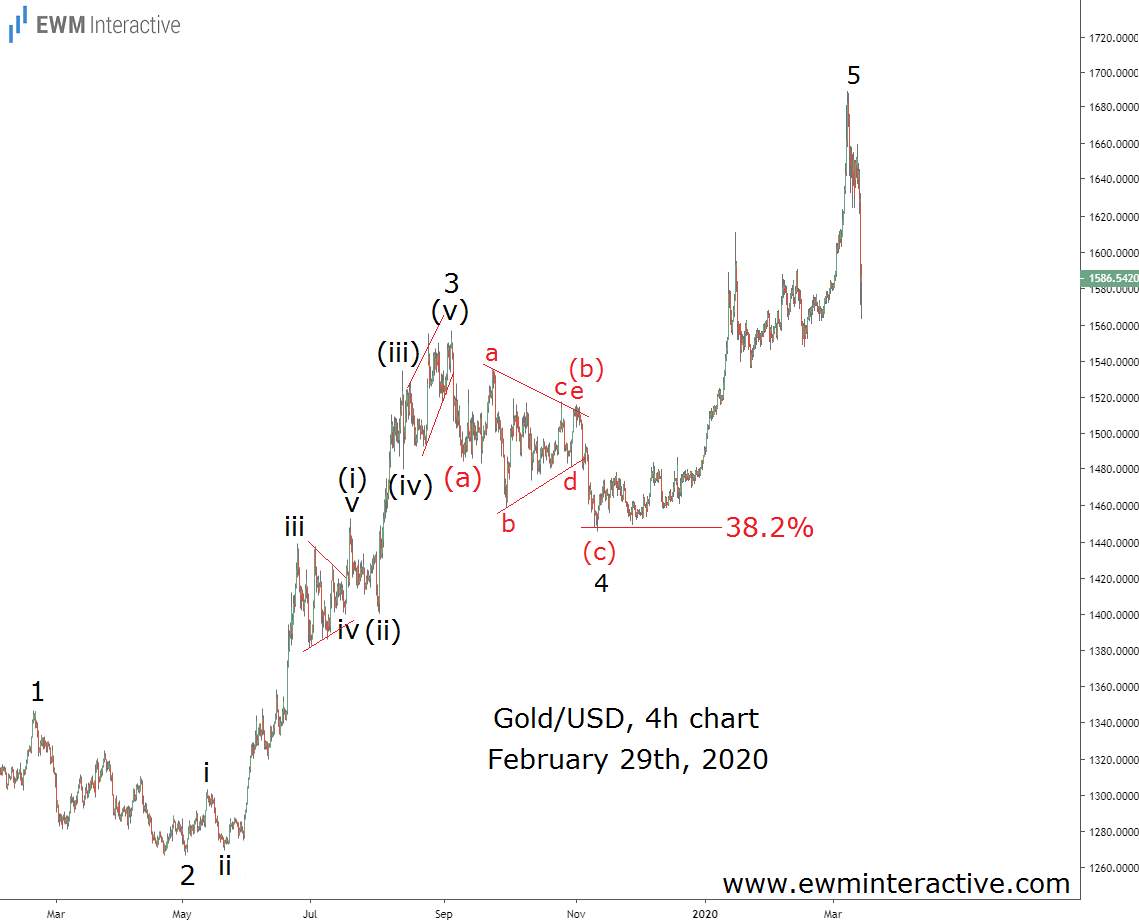
Gold reached $1689 on Monday, but spent the rest of the week declining. A single Elliott Wave pattern proved more reliable than all the bullish reasons above. So the next time you find yourself thinking “this is happening, so the price of X must go up/down” don’t forget to check the charts. Do the patterns support your logic?