Huge Reversal In Precious Metals But Fundamentals Improving
To underscore the volatility of this past week, consider the price action in silver.
Silver, days ago, had a chance to make its highest monthly close since October 2016. That is well over three years ago. Silver closed the week and the month at its lowest levels in six months.
One week, precious metals (specifically gold stocks) are on the cusp of a historic breakout and the next, they are blowing through support levels. Such can be life in this sector.
Before I get to fundamentals, let’s look at the technicals and key levels for gold stocks.
The key support levels for Van
Eck Vectors Gold Miners ETF (NYSE:GDX) are $25-$26 and that support did produce a bounce on Friday. However, we should also note the 400-day moving average and its equivalents, which is at $23.58 and rising.
The key support levels for Van
Eck Vectors Junior Gold Miners ETF (NYSE:GDXJ) are $34-$36 and the 400-day moving average, which is at $33.60.
Note how the 400-day moving average (shown below as the weekly equivalent) has done an excellent job defining the primary trend. Despite the horrific week, the primary trend remains up.
The Gold Miners 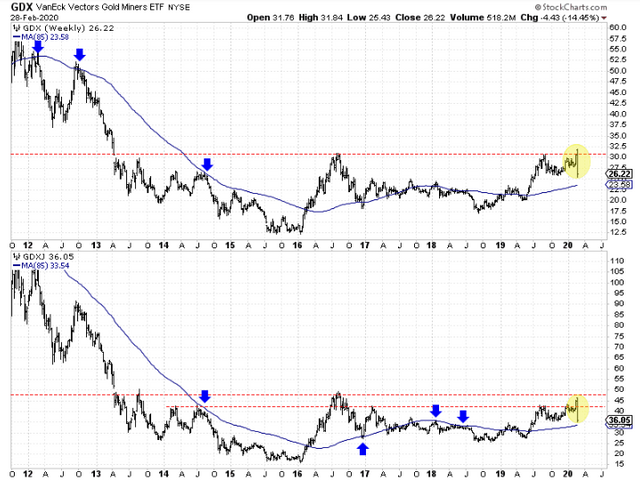 The Gold Miners
The reason why you should not be discouraged is the fundamentals are strengthening.
In recent days, the real 5-year yield (as measured by the TIPS market) has plunged. We plot gold and the real 5-year yield in the chart below.
Daily Gold 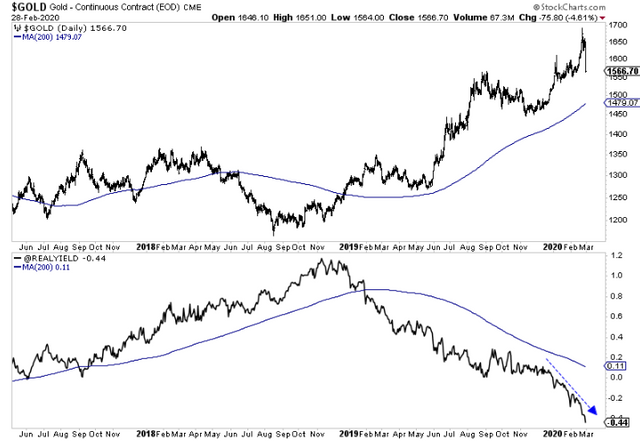 Daily Gold
It is possible that inflation expectations could dive and real rates could rebound temporarily but the larger trend is for real rates to continue to decline.
Last I checked, Fed funds futures were showing a 91% chance of a 50-point cut (not 25 points) in March. They are also showing nearly a 1% reduction in rates (four rate cuts) by the end of the year.
This past week was an orgasm for deflationists but the data is not in their favor. Don’t expect inflation to decline that much or any decline in inflation to be sustainable.
The banks and housing market are in much better shape than in 2008. The same is true for households. According to BCA Research, household debt service payments as a percentage of disposable income are around 40-year lows.
Moving elsewhere, another significant bullish development is the potential for gold and gold stocks to begin an uptrend relative to the stock market.
This has been the missing ingredient for the precious metals sector in recent years. If we see a new sustained trend of capital moving out of the stock market and into gold and gold stocks, it would be bullish for precious metals.
Gold:SPX Ratio, GDX:SPX Ratio (bottom) 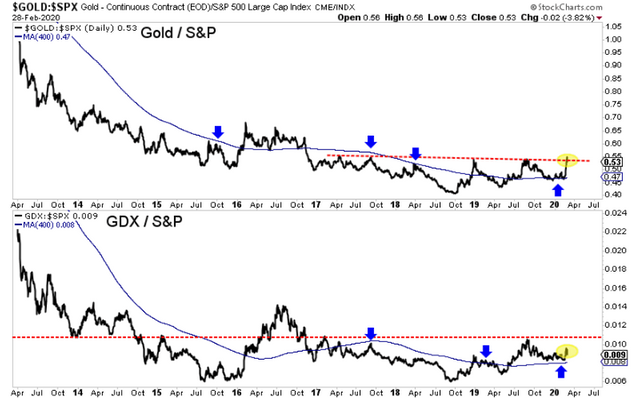 Gold:SPX Ratio, GDX:SPX Ratio (bottom)To sum things up, precious metals are experiencing a sharp, sudden drawdown within a primary uptrend. The 400-day moving averages could be tested in gold stocks and silver.
In some respects, this is a mini-2008.
An outside event is causing forced selling and sudden liquidation, which is leading to a massive response by policymakers that ultimately strengthens the fundamentals of the sector and leads to even greater upside potential.
Look for an initial rebound next week and perhaps another wave of selling that retests Friday’s lows. We want to be buyers on “fishing line” declines.
This is very painful now but it’s going to lead to even more 3-to-5-baggers over the next 12 months.
We continue to focus on identifying and accumulating the juniors with significant upside potential in 2020.