Graph all the things!!!@#1eleven!!!: Steemit Dashboard
Hello from Steemit HQ!
"If you start measuring something you start optimizing it" —Paul Graham
Recently we got a new toy on our quest to be more data-driven:
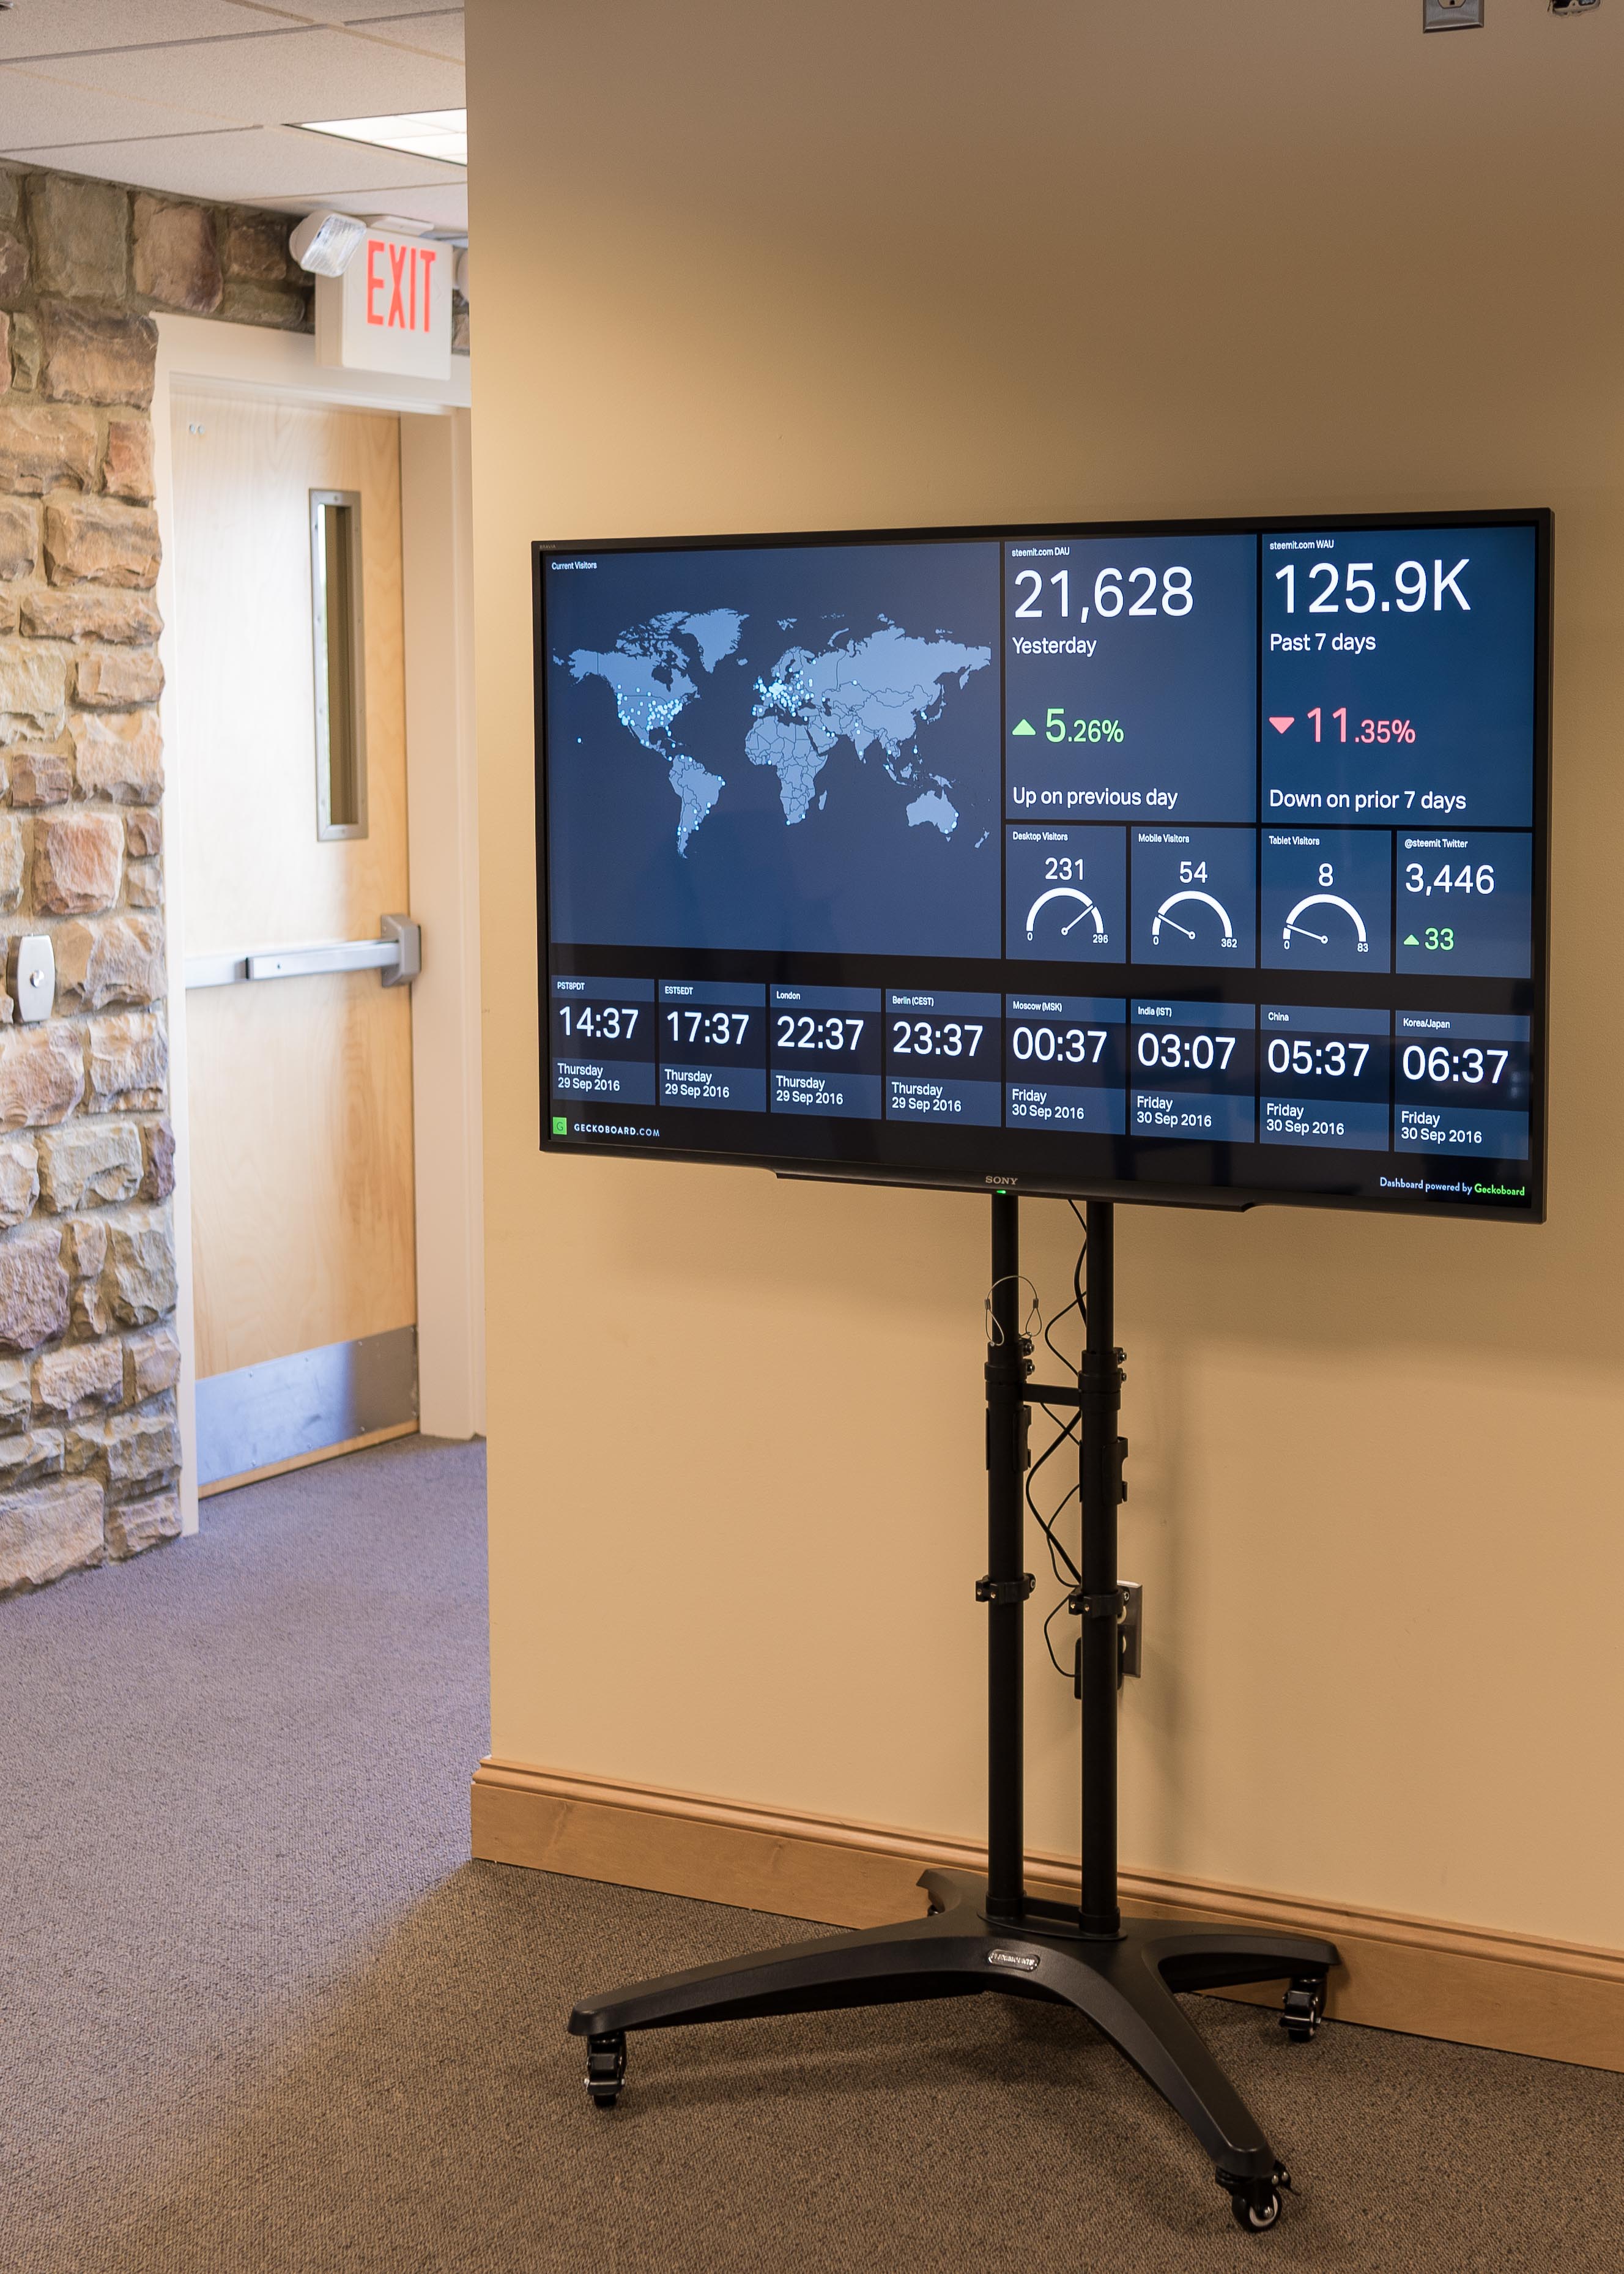
This post is to share and document how we got it running quickly and inexpensively.
Four pieces of hardware are required:
- VESA-mount TV stand: https://www.amazon.com/dp/B015PMEW3I
- Asus Chromebox-M004U Deluxe (per Geckoboard hardware FAQ): https://www.amazon.com/dp/B00K048H7E
- Sony KDL55W650D 55-Inch 1080p LCD TV: https://www.amazon.com/dp/B01F4SWA9Q
- (Any standard 1080p TV with HDMI will do.)
- Standard HDMI cable (because neither the TV nor Chromebox comes with one, grr).
Hardware Setup
Screw the TV into the stand. Plug the HDMI cable into the TV and the Chromebox. Stick the Chromebox to the back of the TV somehow so it doesn't dangle. Plug both into mains power.
Dashboard Setup
You can do this part in a browser without the hardware, as the dashboard is all web-based/HTML. We're using Geckoboard for the moment (fastest time to set up, but carries a monthly recurring cost) but will likely look into self-hosting Dashing in the future.
We've hooked it into Google Analytics and some other data sources like New Relic and our internal tools and data sources, including some from @roadscape's ever-useful steemd.com.
Chromebox Setup
On first boot, connect the Chromebox to the wireless network, but don't log in. Hit Control-Alt-K and enable Kiosk mode. Then, log in with a throwaway Google account created specifically for the purpose (the guest account won't work for the kiosk mode unfortunately, as it needs to save an extension and the guest account doesn't seem to persist any data).
Install the Kiosk Chrome extension from Matt Cook (which allows any specified URL to be loaded fullscreen in kiosk mode).
Open a new tab and enter chrome://extensions. Check the box next to Developer Mode. Click Add Kiosk Application and enter the id of the Kiosk extension just installed (afhcomalholahplbjhnmahkoekoijban). Highlight the Kiosk App and select "auto launch". Save/Done/Exit. Reboot the device.
Don't unhook your keyboard and mouse yet. On boot, your kiosk autostart application choice will be confirmed. This only happens once, then it will autostart on boot. Once you confirm, the Kiosk app will start. Set your dashboard URL (or a URL redirect you can control/update, if you want to change it later without touching the hardware - we use a Geckoboard dashboard loop URL), set it to hide the mouse cursor, and set it to reboot every night at 4AM just to be safe against memory leaks. Save and reboot once more, and you should be done!
When it powers on, it will autoload the Kiosk app without interaction, and the Kiosk app will load the specified URL fullscreen.
The Future
We're super excited about all the neat stuff we can put on this thing (with Geckoboard, it can support "dashboard loops" which cycle through a set of different dashboards at a configurable interval, sort of like an image carousel) including site and service performance, social media activity, site volume, economic summaries, et c.
Some of the more interesting or novel metrics that were floated around are:
- Steem Power Gini coefficient
- Ratio of Steem Dollar-to-USD-via-BTC to Steem Dollar peg feed (peg divergence)
- Daily Comment, Vote, and Post volumes
- Traditional "boring" economic ones like market cap, exchange volumes/liquidity
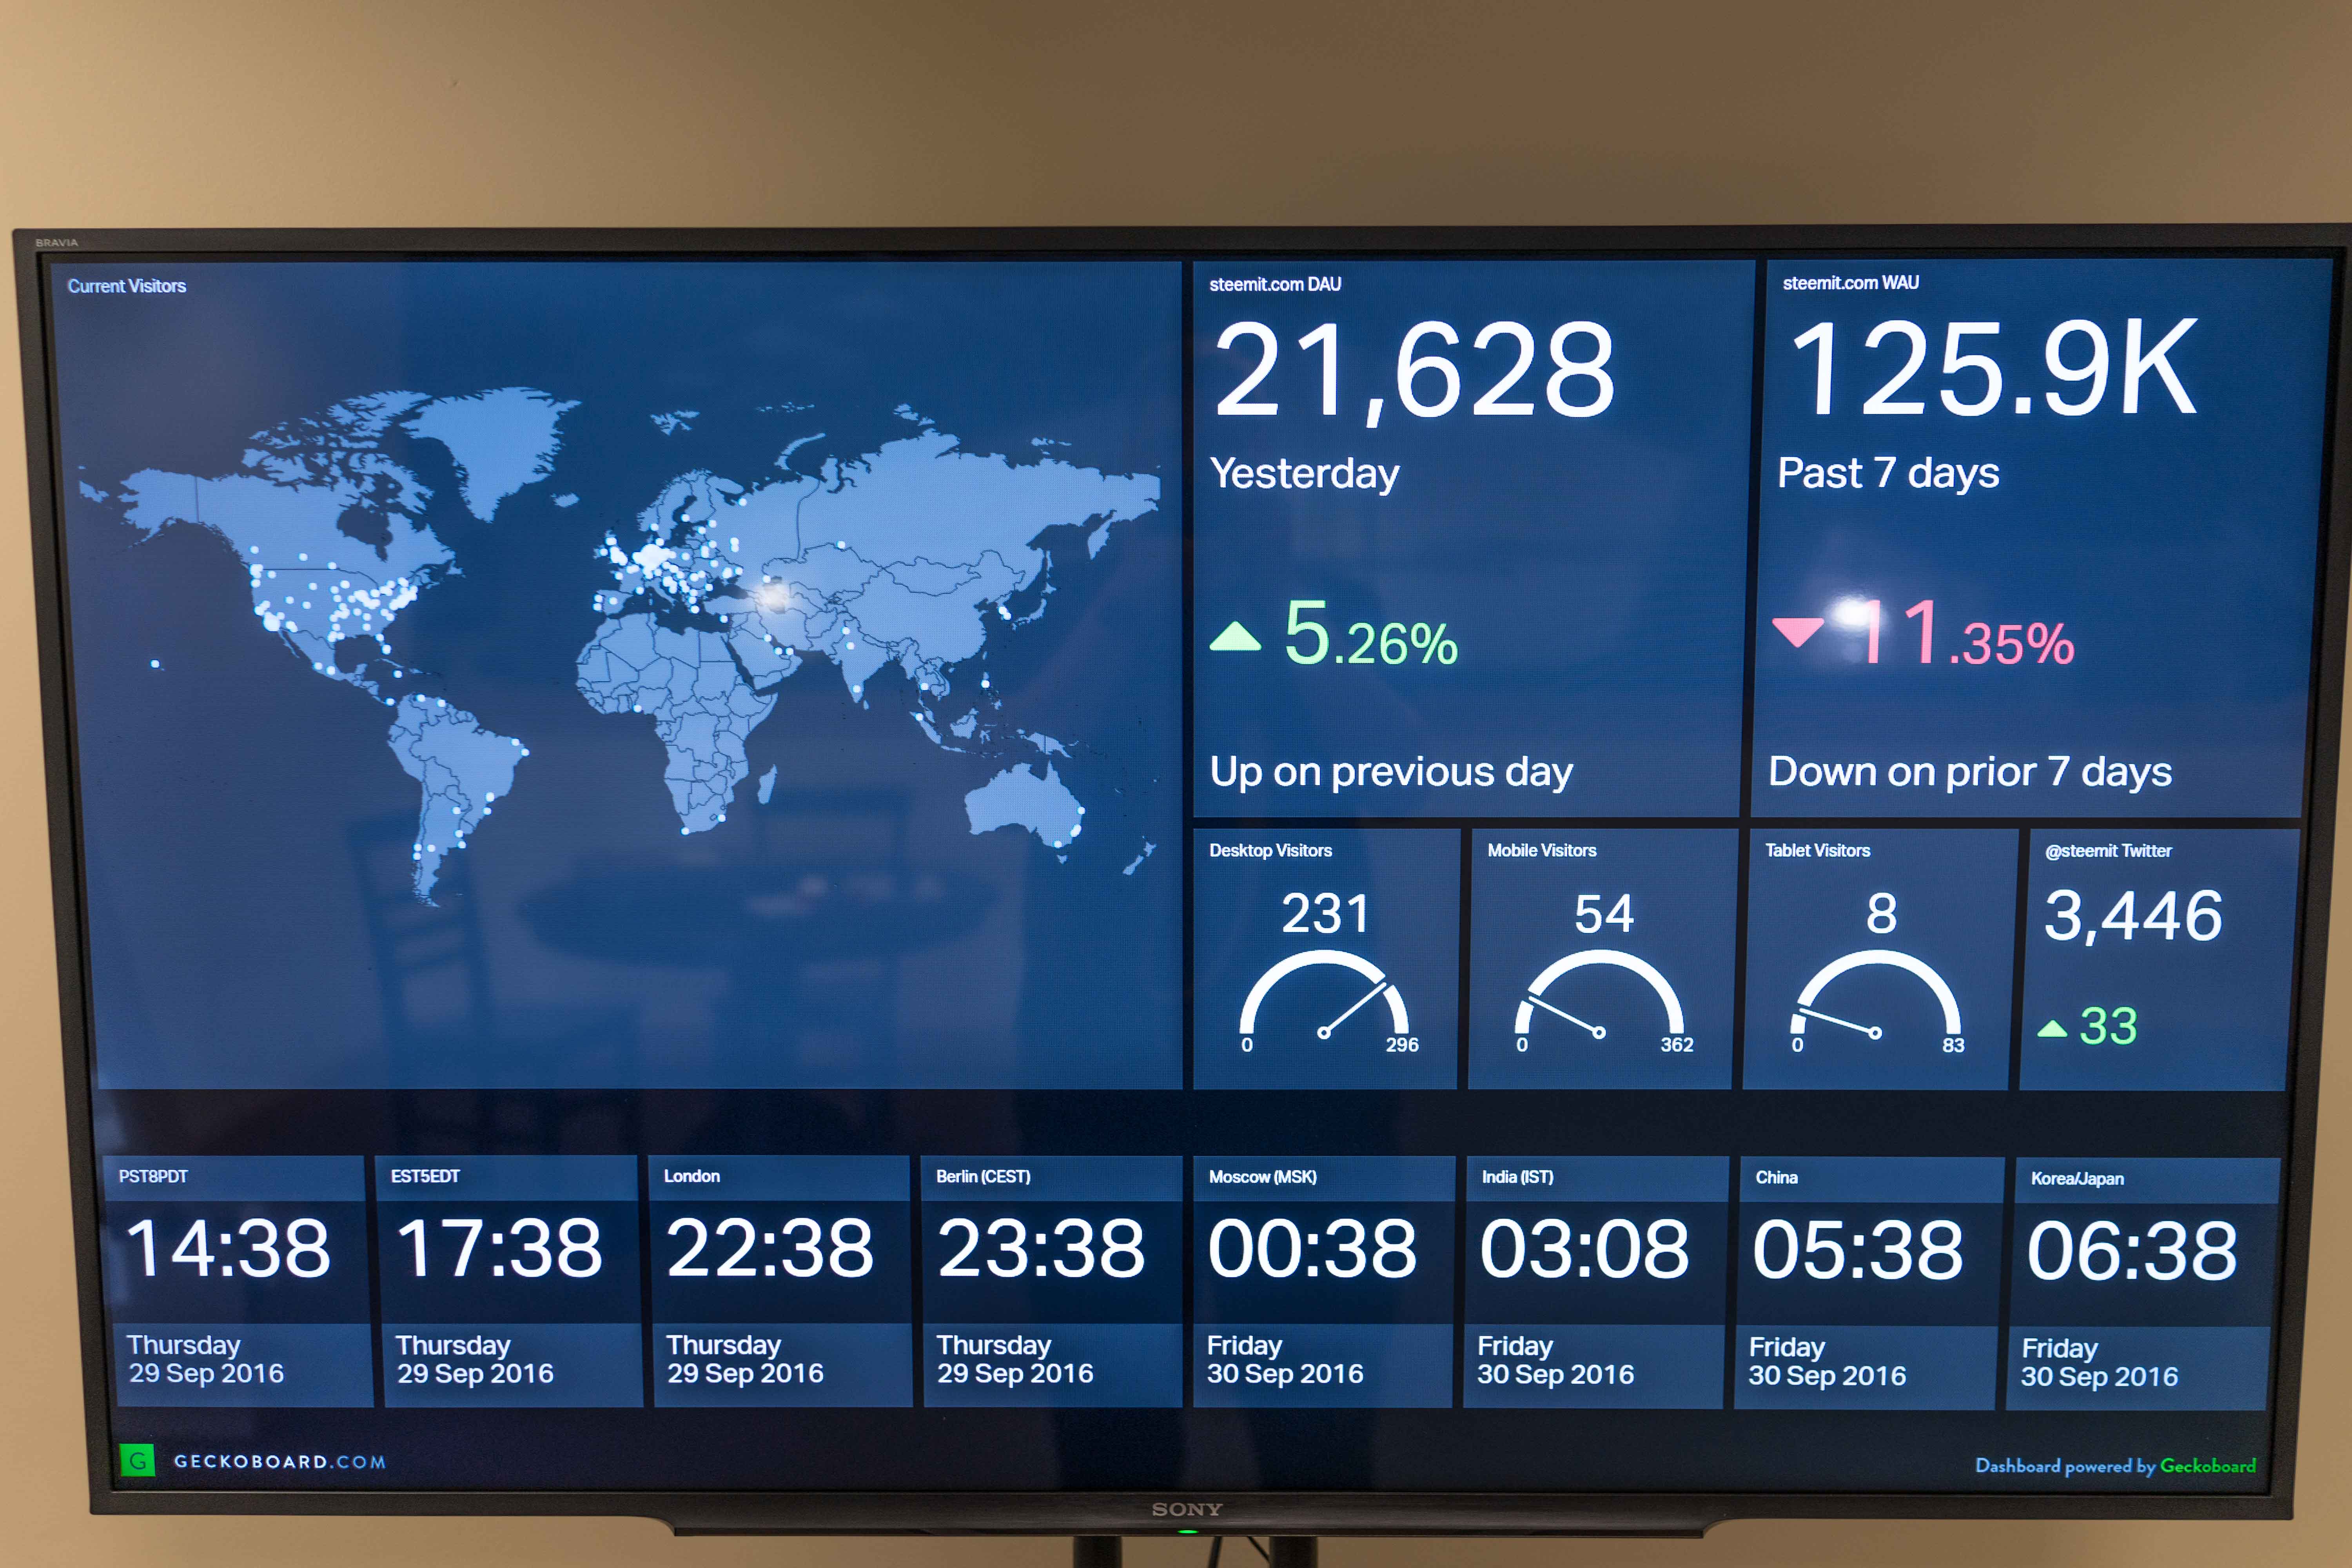
For now, we've focused simply on the location and count of active unique visitors to the site, because growing the quality and size of the Steem community is our primary mission. Next up will be performance and latency metrics related to site service and user interface speeds, these being highly important to us as heavy daily users of the site. We've got some big improvements in this area planned in the short term, and we're excited to see the boost in this department soon reflected in the big charts.
Suggestions for useful metrics are encouraged, as we will probably deploy a couple more of these for specific teams in the future. I'm sure we haven't thought of everything yet.
Thanks for reading!
Nice to see there is a dot on Sofia :) That's probably me :) There is in fact at least another 3 users located in Bulgaria, I know one is in Pazardzhik, another in Varna, and I'm not sure about the other.
nice @sneak!
The future looks good doesn't it ?<3
That a great tutorial. I would love to implement this in the organisation where I Work.
That's deadly!!
Looks like zero visit from China?
That's why we put the clocks on the bottom for the different timezones - at the time of the photos, it was around 05:30 there - most everyone in China is asleep at that hour.
You mean the data in the graph is of recent 1 hour or something? I thought it was of 1 day or so.
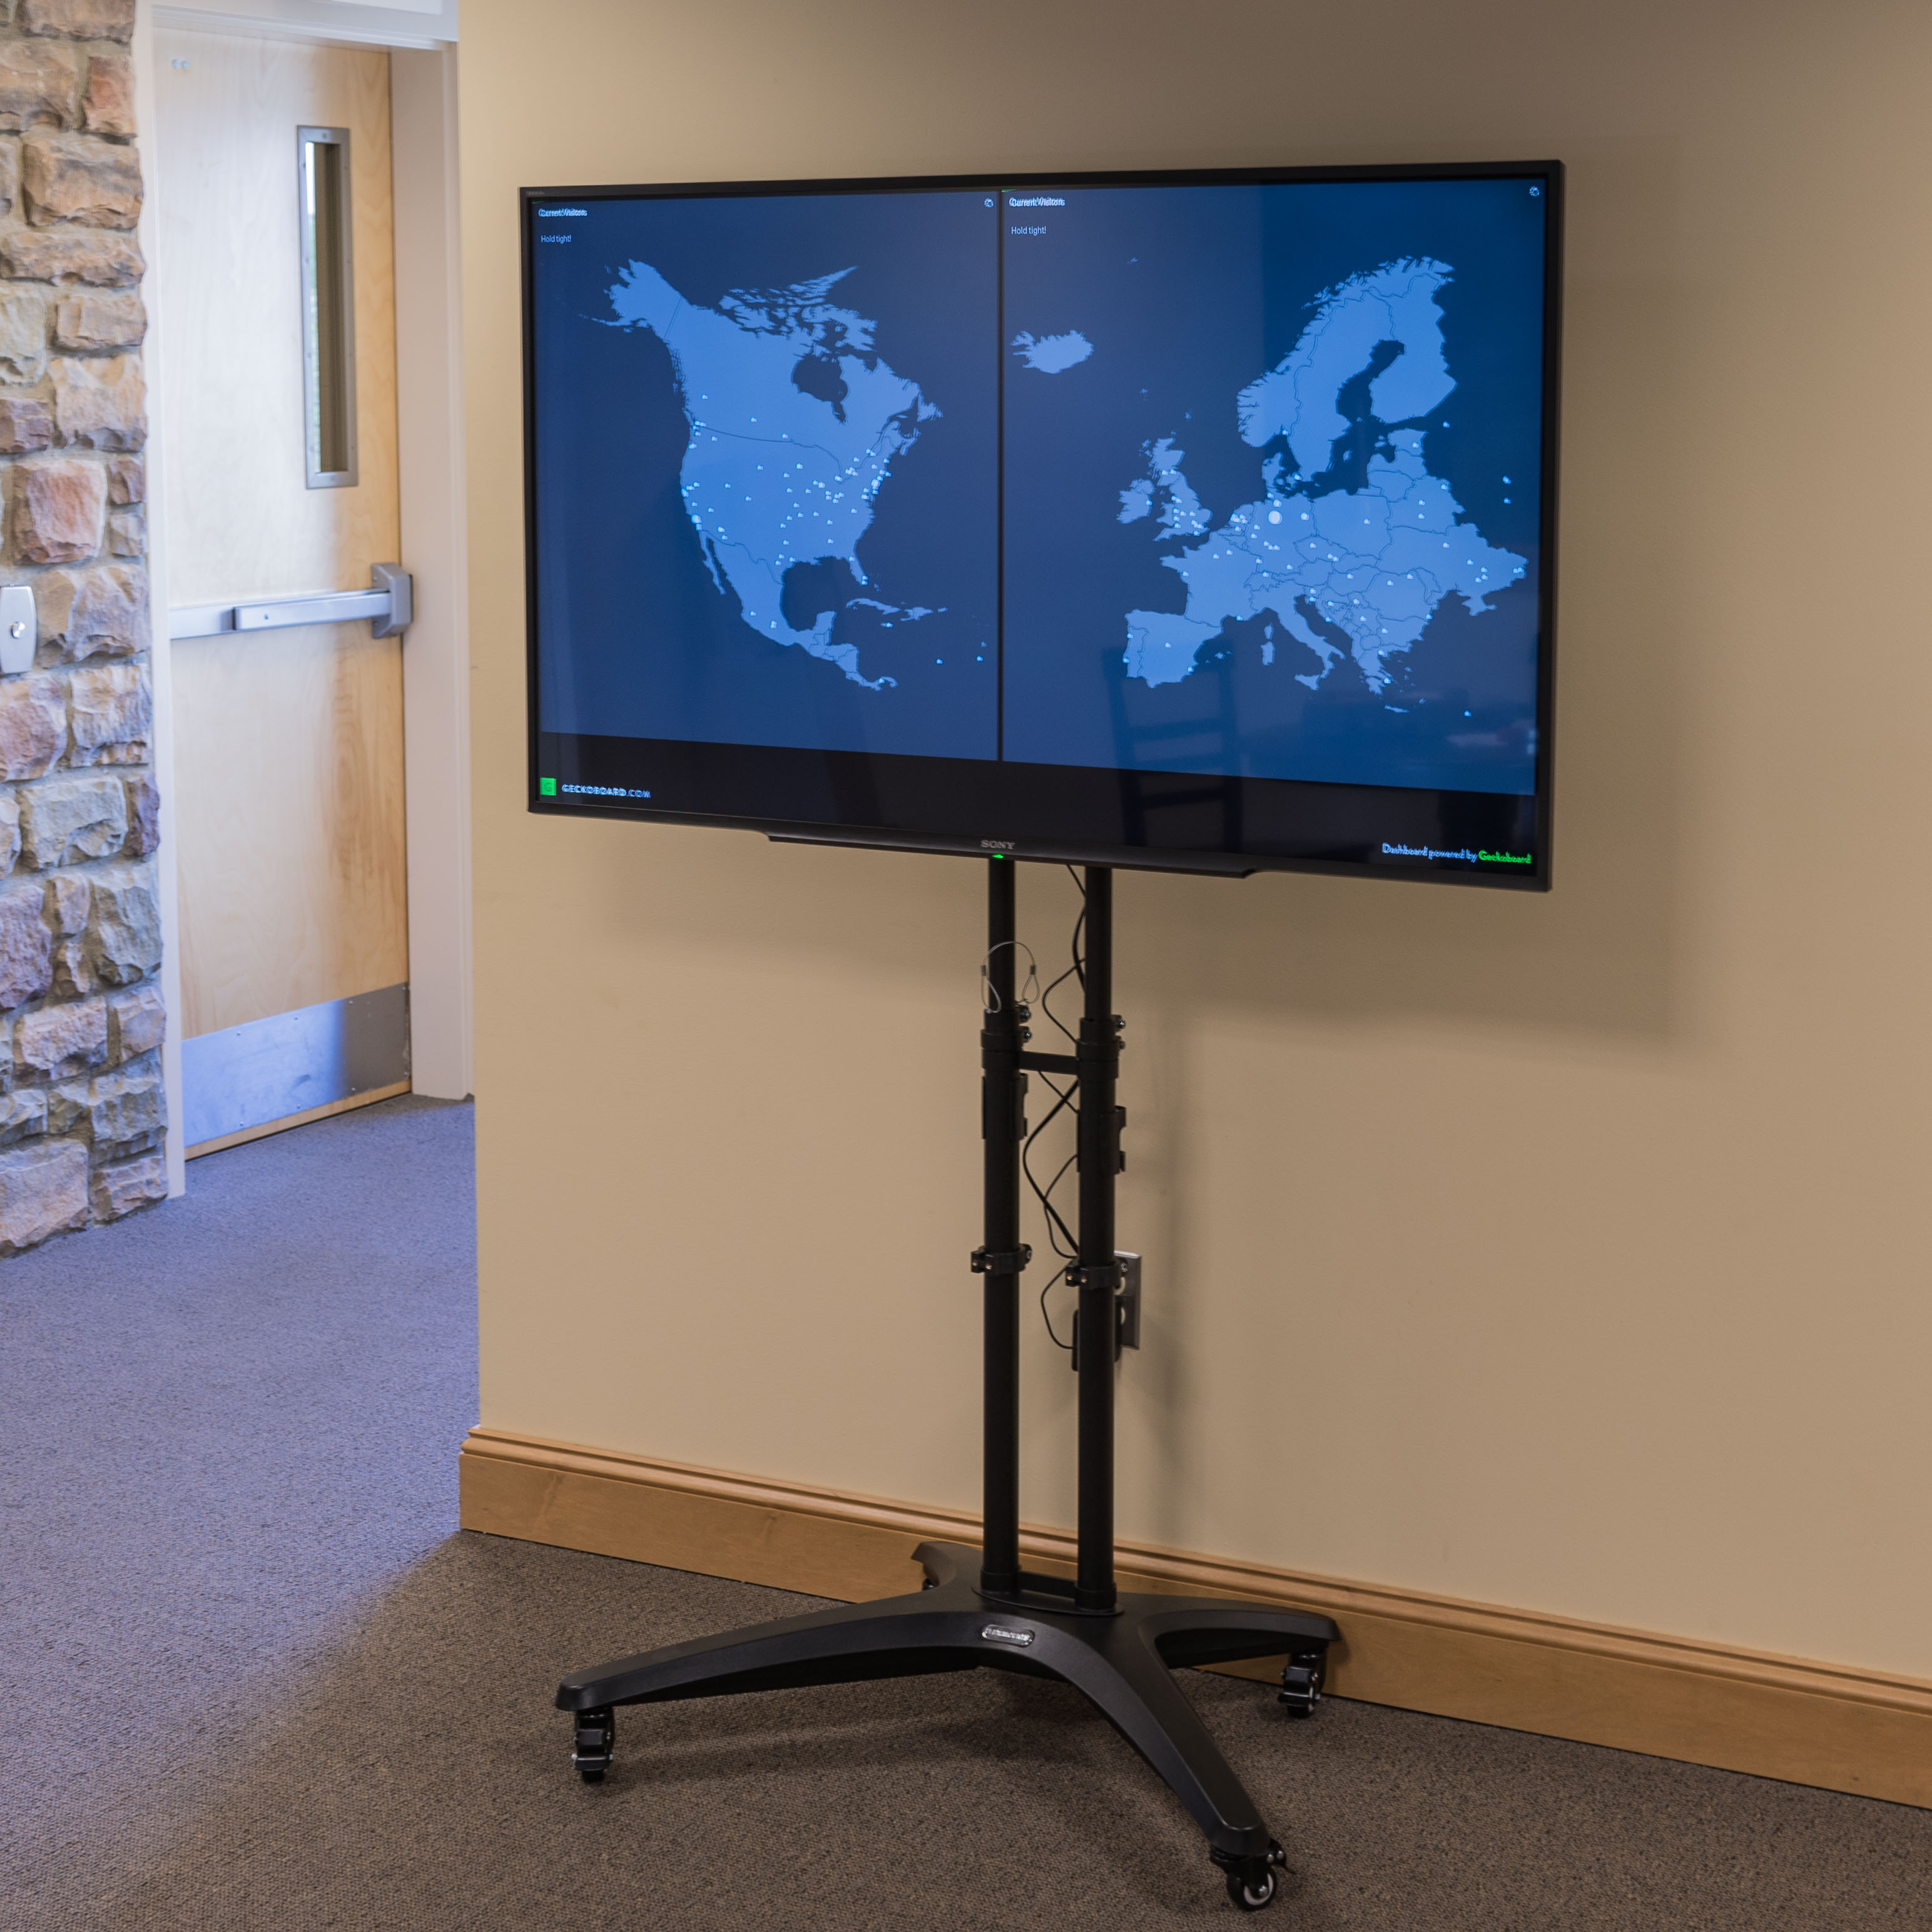
The dots on the map are realtime. The other data has the time range specified (i.e. 1d or 7d).
Strasbourg, France
here we are :)