Bitcoin, Ethereum, Bitcoin Cash, Ripple, Stellar, Litecoin, Cardano, NEO, EOS: Price Analysis, Feb. 26

Goldman Sachs funded, Circle, a cryptocurrency-focused financial-services firm, has purchased the US-based cryptocurrency exchange Poloniex for $400 million. This shows that large financial institutions are looking for opportunities to grow business in the crypto world. This move, while prices have been in a downswing, might boost positive sentiment.
While a number of nations are looking at ways to regulate crypto trading, the Venezuelan government believes that cryptocurrency is an easy way out of its troubles. After the launch of its oil-backed cryptocurrency, Petro, the government has started free cryptocurrency trading courses for its citizens.
Still, the success of the Petro is a big question mark for the future.
Meanwhile, let’s look at the top cryptocurrencies and see if we can find any profitable trading opportunities.
BTC/USD
In our previous analysis, we had suggested long positions for the aggressive traders in Bitcoin, but it did not move according to our expectation. It turned down from $10,770.23 on Feb. 24 and fell to a low of $9,502.25 yesterday, Feb. 25, but remained above our suggested stop loss of $9,400. The bears were not able to capitalize on the weakness and break below the critical support.
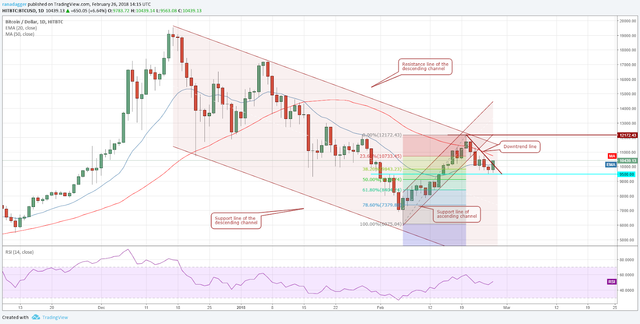
Today, the bulls have seized the opportunity and have broken out of the downtrend line and the 20-day EMA, which is a bullish sign. They have one more major hurdle in the way of the 50-day SMA at $10,745. Once the price breaks out of the $10,745 to $10,770 resistance zone, it should move towards the resistance line of the descending channel at $11,500.
There is no change to our recommended stop loss of $9,400, but if the traders find that the cryptocurrency is unable to break out of $10,700, they can raise the stops to breakeven. Let’s play it safe.
The BTC/USD pair will be out of the woods once it clears the $12,200 mark. We also see an inverted head and shoulders pattern forming, which should complete in a few days. If this happens, it will indicate a change in trend and traders can expect higher levels.
Our bullish view will be invalidated if the bears break down below $9,400 levels.
ETH/USD
Traders who follow us would have entered long positions in Ethereum around the $830 mark, as suggested in our previous analysis.
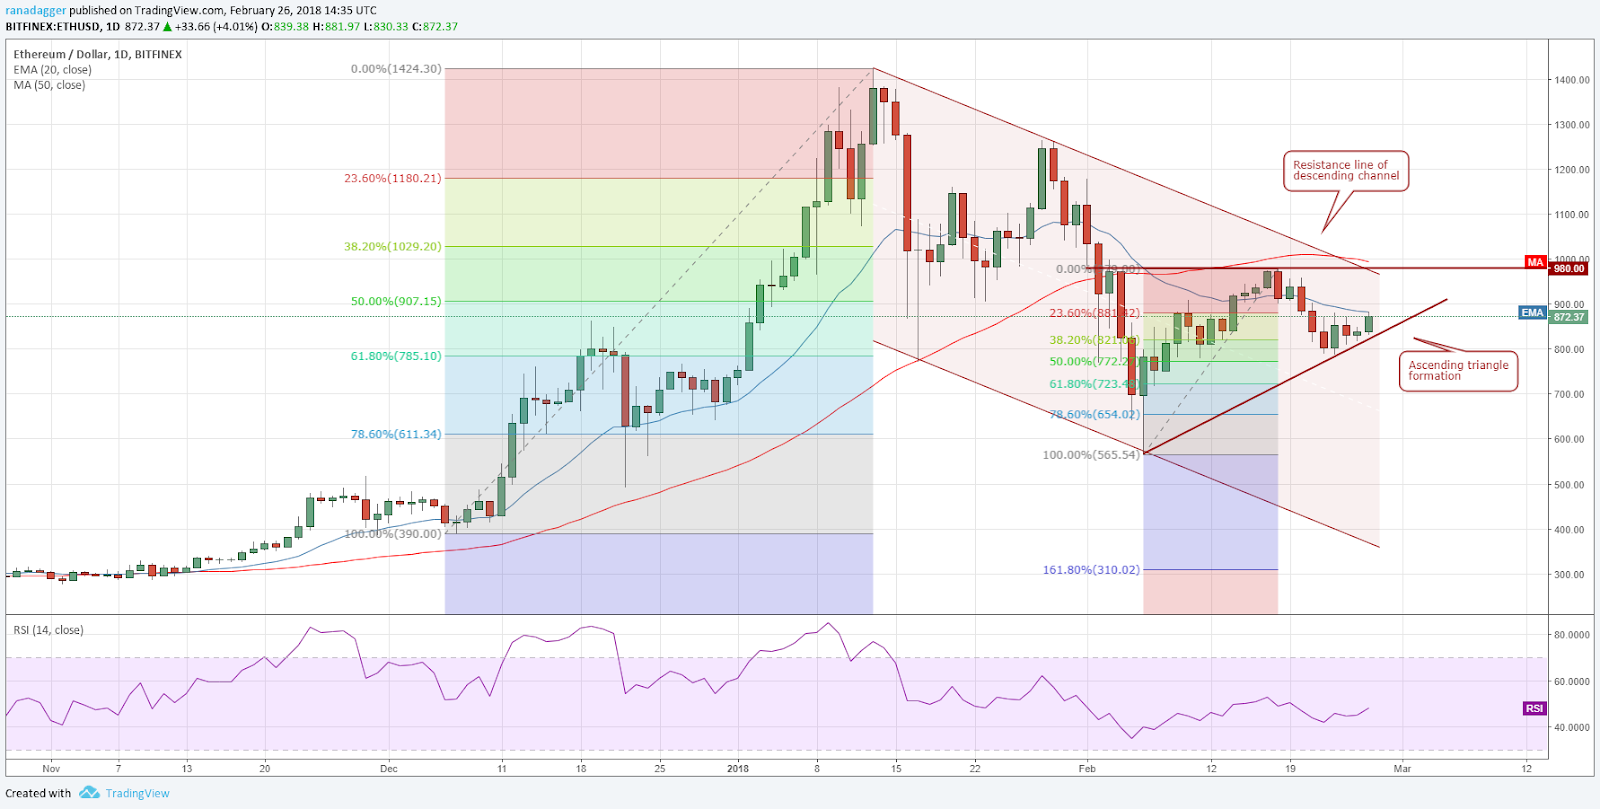
Currently, the price is at the 20-day EMA, which may offer strong resistance. But we like the way the ETH/USD pair sustained above the $808 mark on the previous two days, Feb. 24 and Feb. 25, and did not challenge the lows formed on Feb. 22 and Feb. 23. This shows that demand is at higher levels.
Once Ethereum breaks out of the 20-day EMA, it is likely to rally to the resistance line of the descending channel close to the $965 mark.
We find an ascending triangle developing, which will complete on a breakout and close above the $1,000 levels. This is a bullish sign. Therefore, traders can book partial profits at $965 and trail the rest with a suitable stop loss to ride the next up move.
But if the price breaks down to $780 levels, our bullish view will be proved wrong.
BCH/USD
We don’t find any buying interest in Bitcoin Cash at the moment. It is struggling to stay above the critical support level of $1,150.
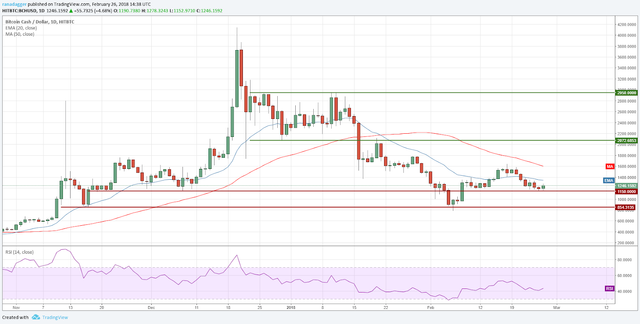
Any recovery attempt will face resistance at the 20-day EMA and the 50-day SMA. The BCH/USD pair will show first signs of strength once it stays above $1,600 levels.
Currently, we don’t find any buy setup, and that’s why we don’t recommend any trade on it.
XRP/USD
The bulls have defended the $0.85 levels for the past five days. Ripple can now remain range bound between $0.85 and $1.22961 for the next few days.
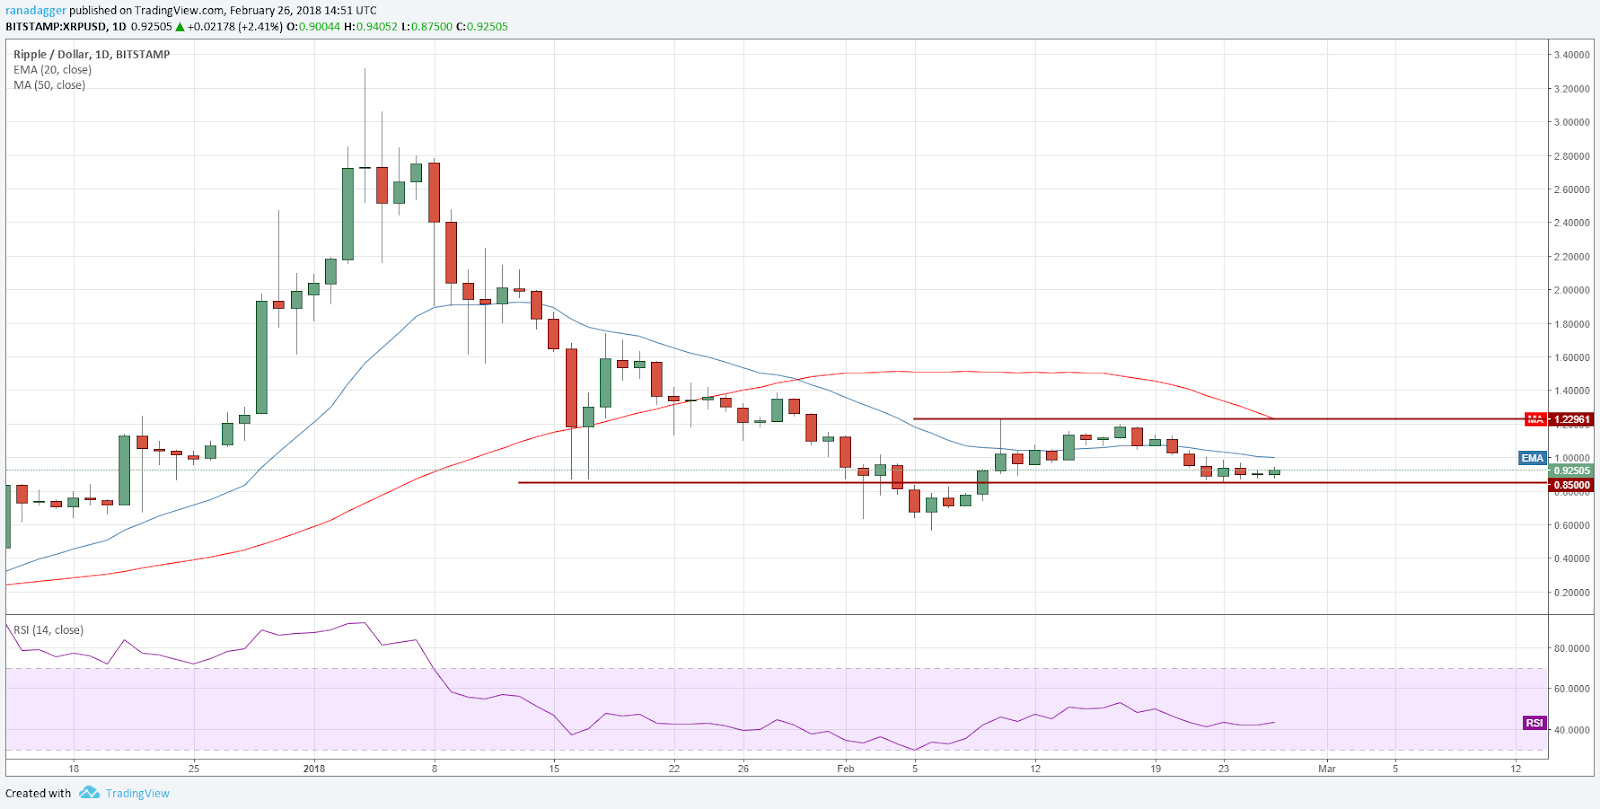
The next leg up will start once the XRP/USD pair breaks out of the range and the 50-day SMA at $1.23. Until then, price action will most likely remain range bound and volatile.
We don’t find any buy setups inside the range; hence, no recommendation on trade so far.
XLM/USD
The bulls have hung on to the critical support zone of $0.32 to $0.35 for the past few days. But they have not been able to push prices higher. As a result, Stellar continues to languish near its recent lows.

If the bears succeed in breaking down below $0.32, it may push the XLM/USD pair towards $0.22 levels.
However, if the bulls assert their supremacy, a range bound trading between $0.32 to $0.47 is likely to ensue. We are not certain about the next price move; therefore, we have provided our view on both possibilities to the traders.
LTC/USD
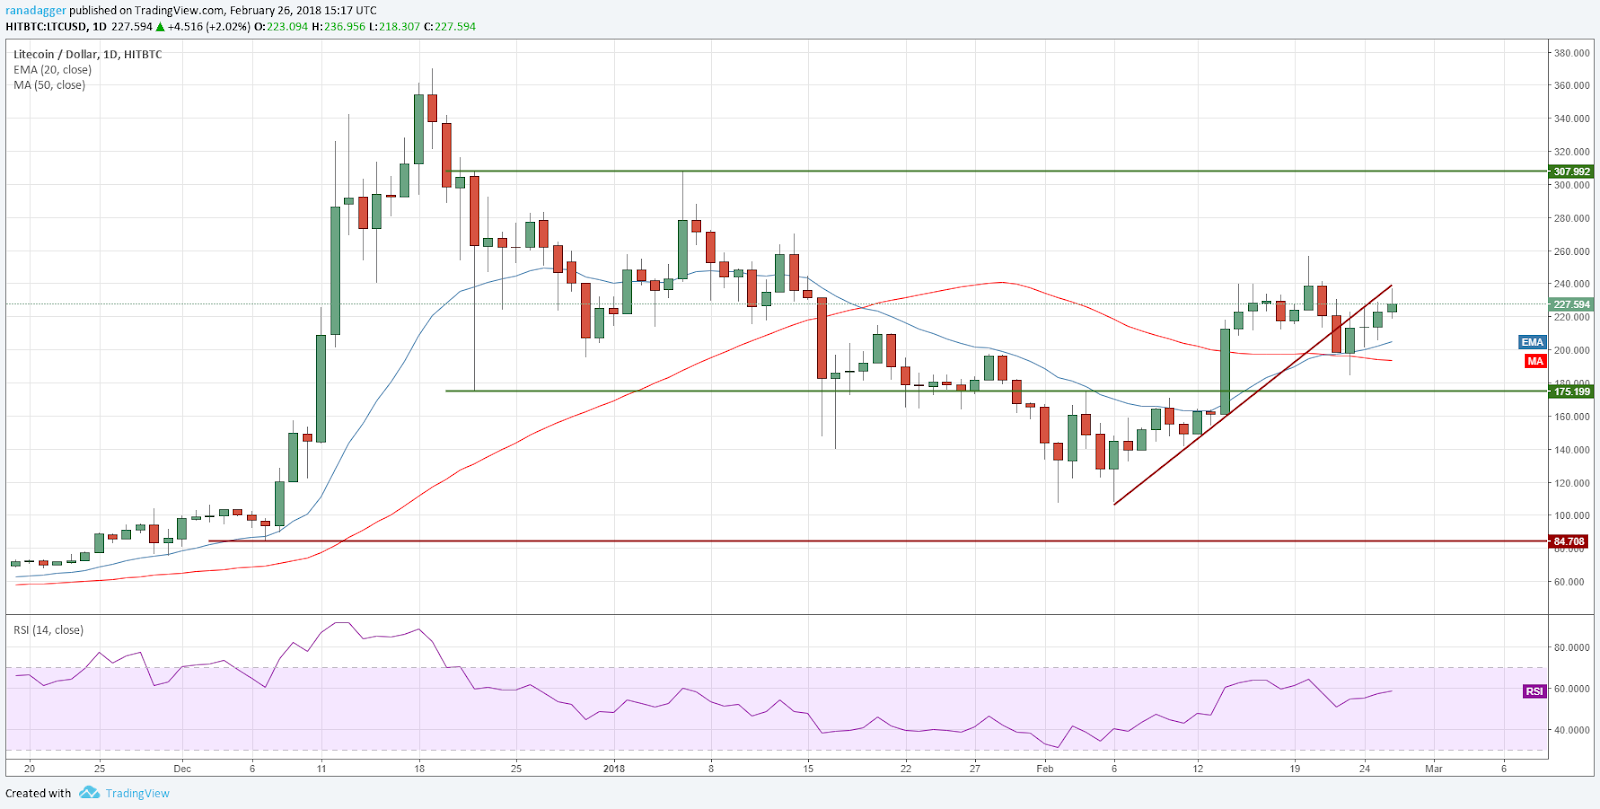
We had recommended traders to build long positions on Litecoin close to the $200 mark with a target objective of $240 and $260. We assume traders would have entered long positions on Feb. 24.
