Bitcoin Price Analysis June.19
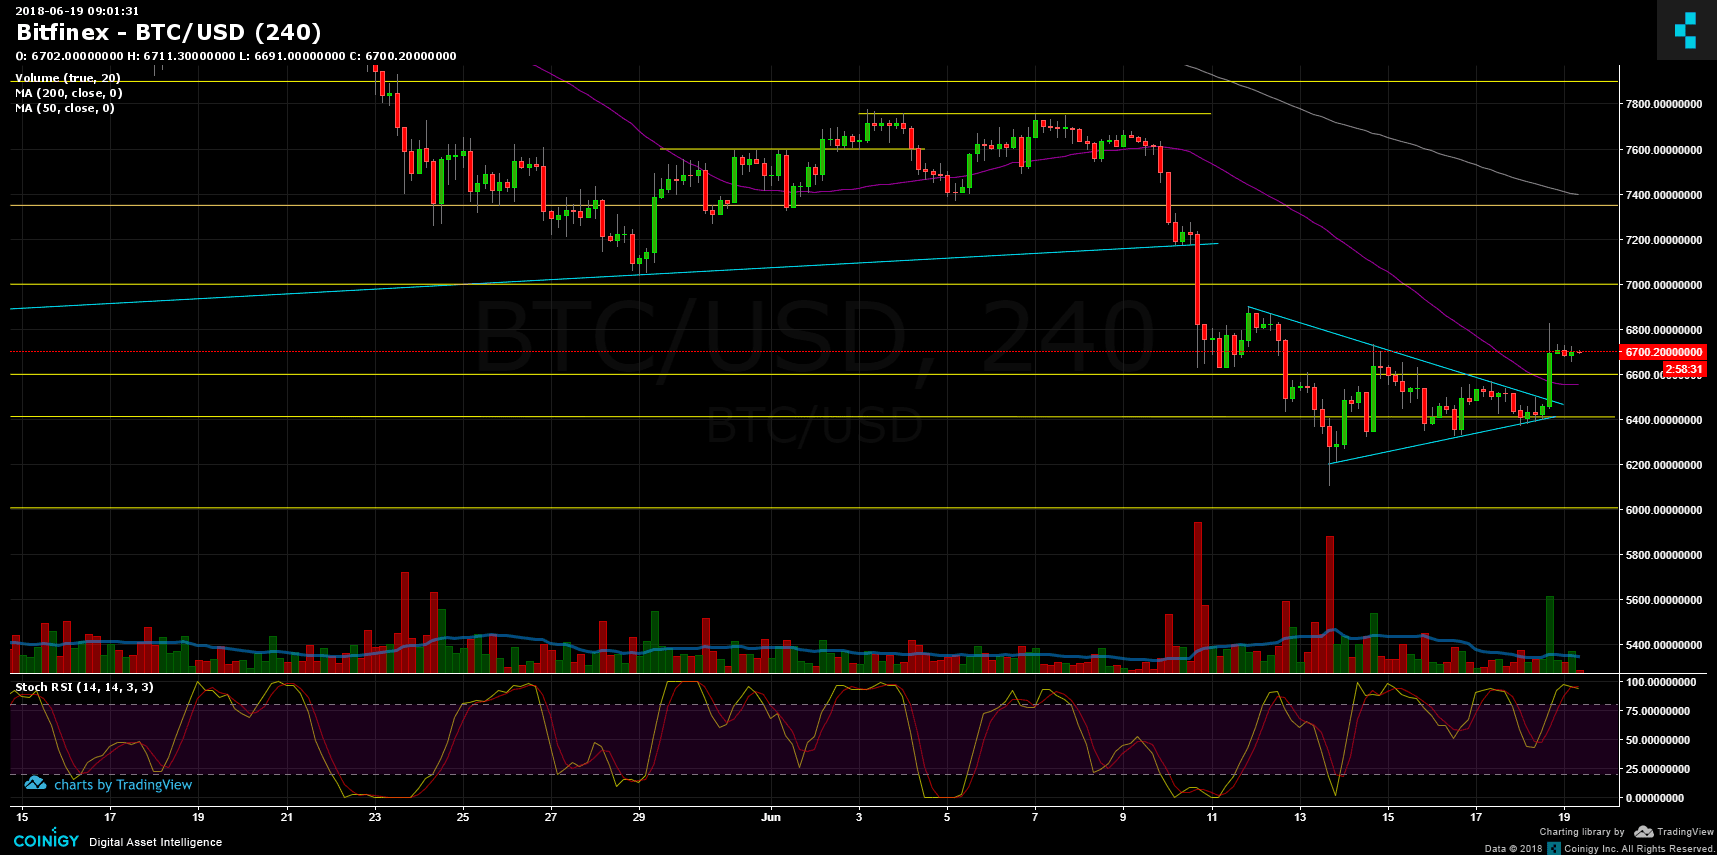
Two days ago, in our previous analysis, we’ve mentioned the triangle formation. As you may notice, Bitcoin had breached the triangle towards the bull side, what produced a nice green candle with a decent volume of buyers, breaking the moving average 50 days (the purple line). The fundamental reason, or trigger, was that the New York’s Department of Financial Services had granted Square a virtual currency license.
During recent hours, Bitcoin has been consolidating around the resistance level of $6,700. From here, next resistance level lays at $7,000 and $7,300 (MA-200 line, marked in gray). RSI is at its highest values, so Bitcoin might need some air before continue up. From the bear side, support level at $6,600 and $6,400.
BTC/USD BitFinex 4 Hours chart
The post Bitcoin Price Analysis June.19 appeared first on CryptoPotato.
Posted from my blog with SteemPress : https://www.sasbit.trade/news/bitcoin-price-analysis-june-19/