Money vs. Cryptocurrency, The Real Costs
Bitcoin, Ethereum, and Blockchain have become part of the technology hype cycle in 2017. Bitcoin continues to set all-time highs day after day, while Ethereum promises to use Blockchain to disrupt almost all financial instruments and business processes. These powerful peer-to-peer systems claim to efficiently dis-intermediate low value-added counter-parties, allowing more money to find its way to individuals creating value. The digitalization of money through cryptocurrencies is supposed to facilitate a new world of instantaneous cheap transactions between all humans and all machines. But how do these systems currently stack up against money, the most basic use case they are supposed to disrupt? To make this assessment, we first need to understand the current money system and the costs associated with it. The two intrinsic costs associated with currency that I will look at here are transaction costs, and the cost of inflation.
Transactions Costs
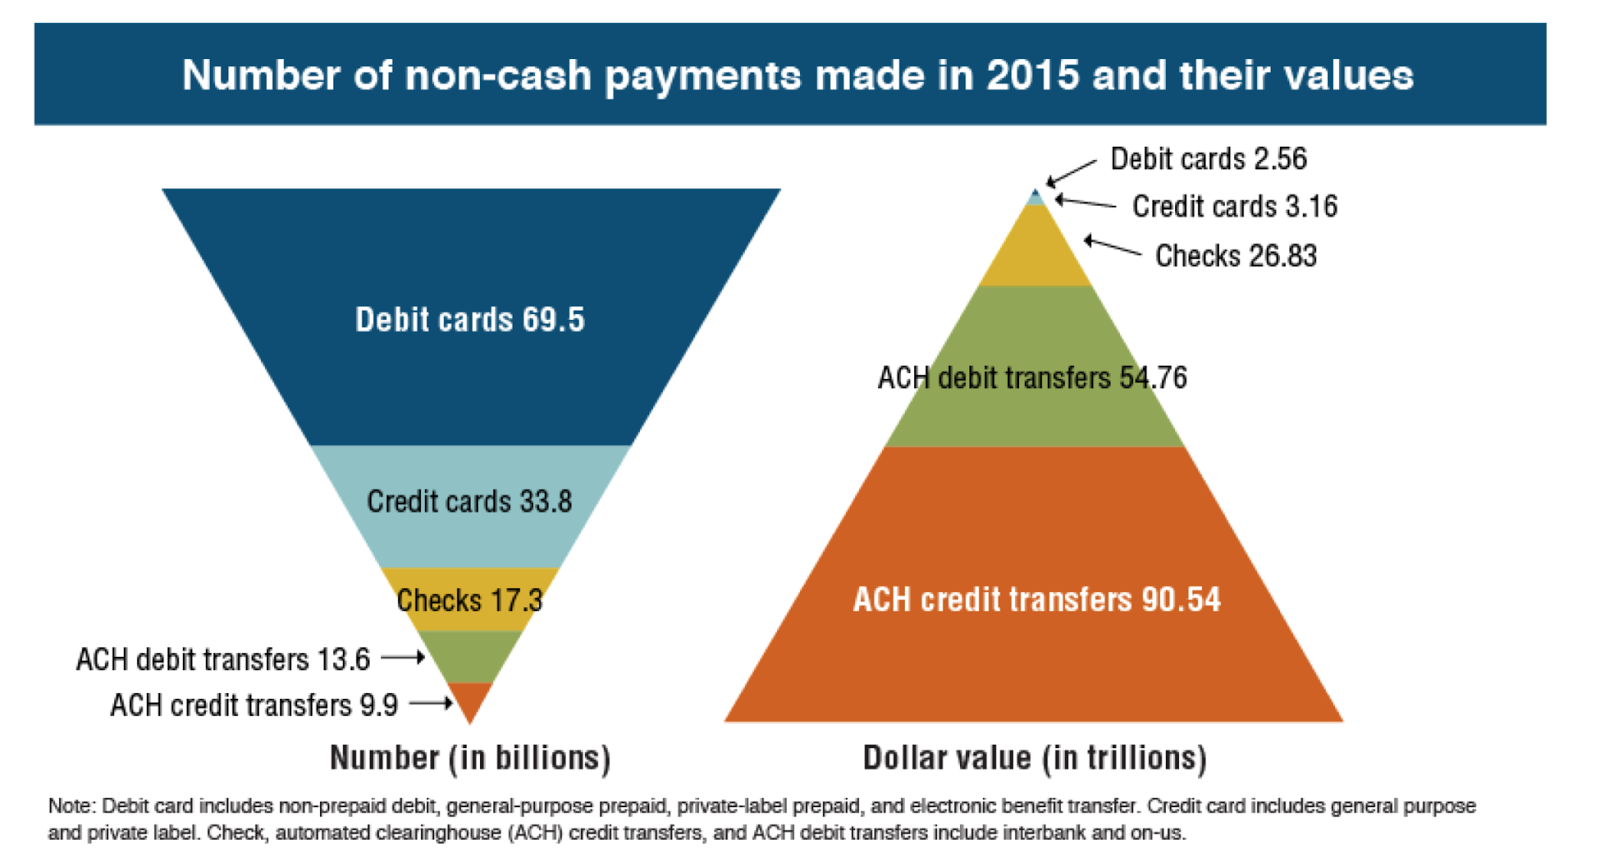
In 2015 cash usage represented 2.35 trillion USD while checks, credit/debit cards, and ACH transfers represented 178 trillion. Shown below is a chart breaking down the composition of non-cash payments 2015. Not surprisingly credit and debit cards are used in the greatest number of transactions (103.3 billion), while representing the smallest amount of value ($5.72 trillion). Therefore, to begin our discussion of the cost of money we will look at credit card payments, how they work, and the costs associated with them.
Credit Cards
Although many in the crypto community like to talk about the fact that credit card transactions can cost the merchant anywhere from 2–3% and that cryptocurrencies can disrupt them, where does the 2–3% actually go? Moreover, what parts of the transaction can cryptocurrencies make more efficient and why?
In a typical credit card transaction there are actually 5 parties that are involved: Consumer, Merchant, Issuer, Acquirer, and Switch. The consumer will typically purchase a good or service from the merchant and the backend of the transaction is facilitated by the issuer, acquirer and switch. The issuer is the bank from which the consumer received their debit or credit card such as JPMorgan Chase, or Wells Fargo. The acquirer is the bank that the merchant uses to process their debit/credit transactions such as Stripe, Square, and Paypal. Then finally the switch, Visa or Mastercard, tie the Issuer and the Acquirer together to complete the transaction.
The switch plays the middleman that is able to connect all of the Merchant’s banks, or Acquirers, to all of the customer banks, or card issuers. This makes it easy for these banks to allow transactions to flow between themselves without having to have specific bilateral relationships. Rather they just have to have relationship with a mutually acceptable switch, such as Visa or Mastercard.
So with this system what are the typical costs and where does the transaction fee go? Below is an example of a consumer making a $100 purchase from a merchant with a credit card.

The consumer pays $100 to the merchant for the good, the merchant then has to pay a 2% fee and a $0.25 transaction charge. This means that the merchant is now left with $97.76, after paying the merchant discount fee of $2.24. The $2.24 is split up between the Issuer, Acquirer and Switch as shown above.
From this example, we can see that the majority of the transaction fee is kept by customer and merchant banks, and only about 0.1% of the transaction goes to Visa or Mastercard. While some of the fee that is charged by the customer’s bank (Issuer) goes to paying for things like fraud (~$0.12), the majority of it is for low value-added services such as advertising including customer rewards. In addition, there are also other costs of fraud and chargebacks that are paid by the merchant which add another (~$0.29)
Automated Clearing House
Electronic transfers or automated clearing house (ACH) payments only had 23.5 billion transactions, but represented over 145.3 trillion in value. ACH payments are the most efficient traditional way to move money electronically in the US. The average ACH payment costs $0.27 and takes 2–3 days to process. More interestingly, the fact that an average of $6,193 money is locked in transit for 2–3 days causes the real value of an ACH transaction to be much higher. If we assume a time value of money of 5% annually and we use the above numbers to determine the lost interest on the money when it is locked in transit for 3 days, this adds an average of $1.69 to each transaction. This means that on average the cost of an ACH is $1.96, but can be dramatically higher depending upon the amount sent.
Bitcoin
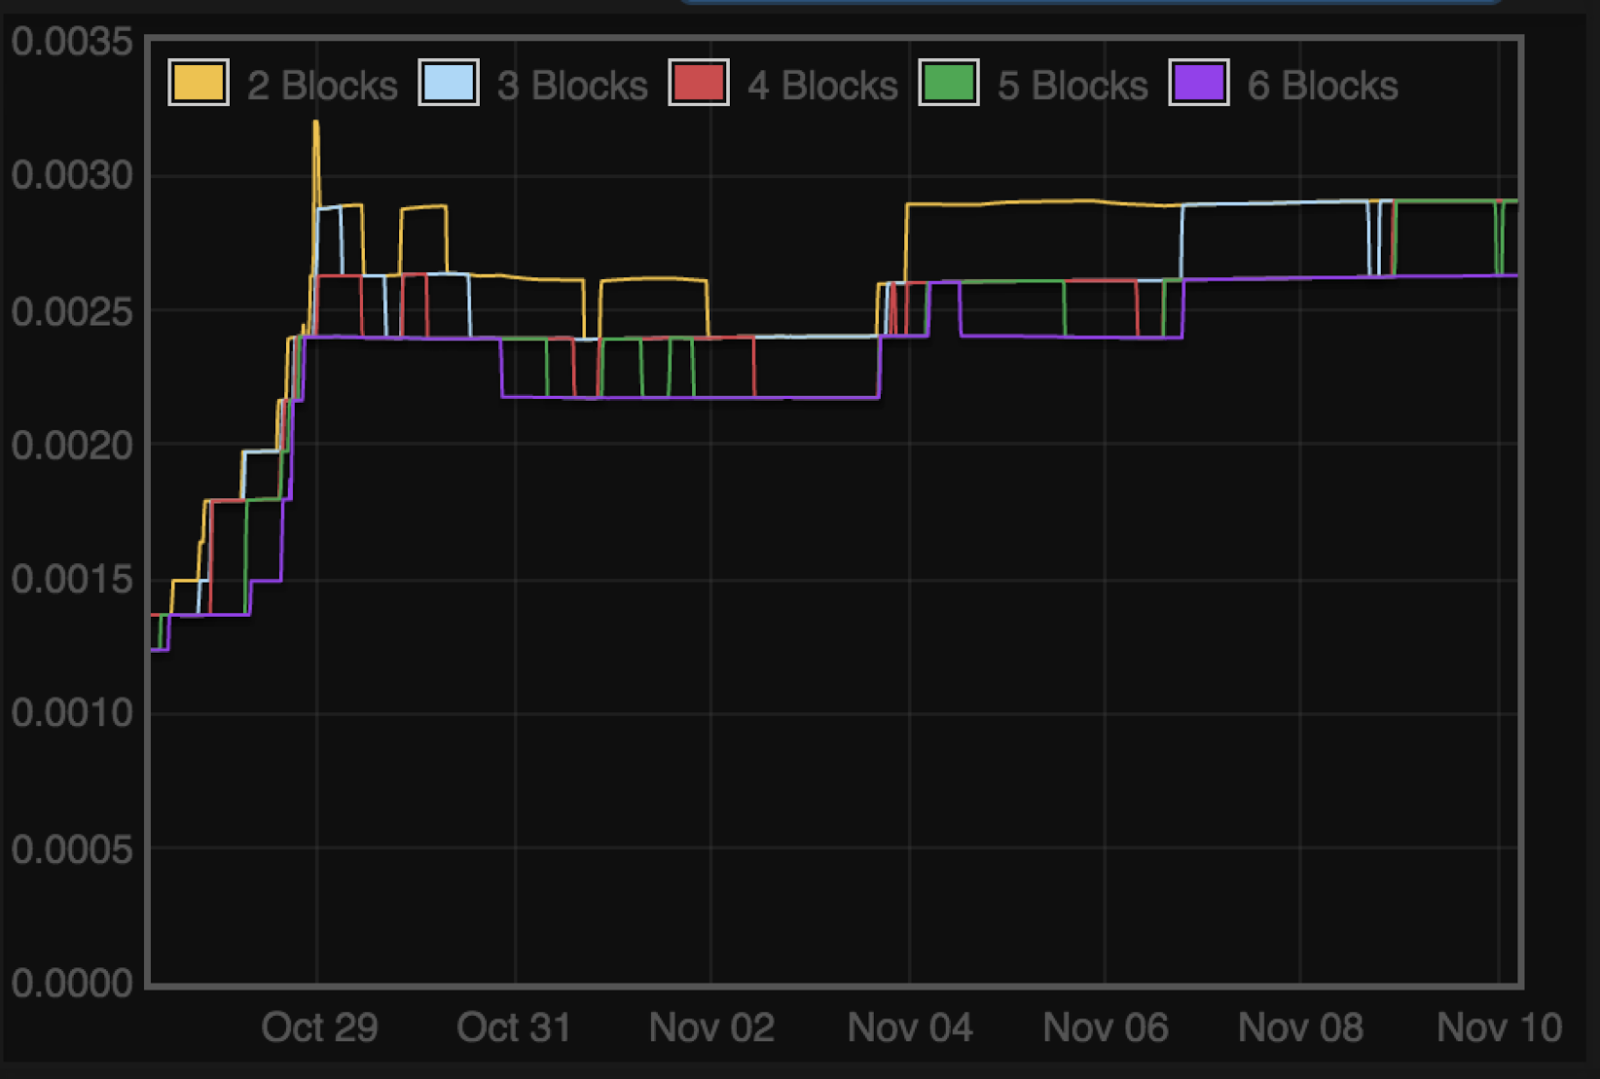
Finally, how much does it cost to make a bitcoin transaction? The following chart was taken from Bitcointicker.co. It shows the cost of a transaction (BTC/Kb) to get it confirmed in a given number of blocks. The size of a simple Bitcoin transaction is around 250 bytes, so to have a Bitcoin transaction happen in less than an hour it currently costs around 0.000625 BTC or ~$4.5.
Ethereum
How about Ethereum. The Ethereum network is able to handle a higher number of transactions per second at a lower cost than Bitcoin. Presently, the cost of having a transaction confirmed in 2 blocks is 1 gwei or $0.007.

Cost of Ethereum Transaction
Summary
All-in-all how do things stack up? The first thing to note is that there are really no real-time electronic methods of payments in the traditional financial system. Credit card transactions are recorded in a few seconds but the settlement of those transactions takes days just like all of the other methods. The fastest traditional method is a wire transfer, which can take as little as 24 hours but it is also the most expensive method of payment in the list. Also, to note is the number of intermediaries in a transaction are dramatically reduced. In both card transactions and ACH transactions there are three backend intermediaries. In cryptocurrencies, there are arguably are no intermediaries.
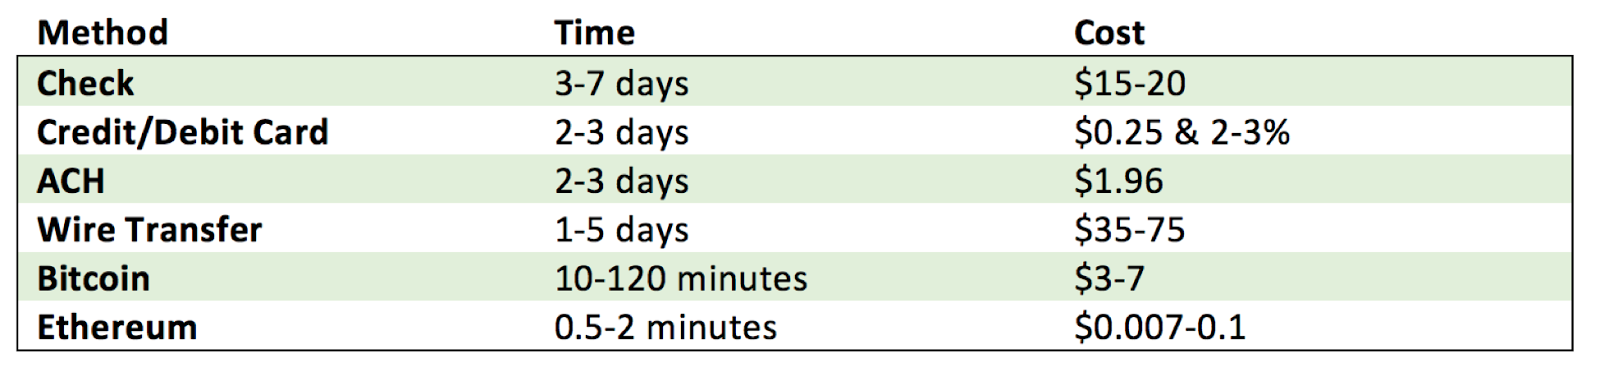
Bitcoin is clearly better than checks and wires, and is only somewhat more expensive for the average ACH when the time-value of money is taken into account. However, the larger the size of the ACH transaction, the more competitive Bitcoin becomes. Additionally, Bitcoin also appears to be cheaper than credit cards for payments greater than $200.
Ethereum is by far currently the least expensive and fastest way to send money with transaction fees of under $0.01 confirming in less than 2 minutes. The one caveat here is that Ethereum does not have the same liquidity in as many currency pairs in as many places as Bitcoin. However, arguably the same way that liquidity and fungibility changed for Bitcoin relative to the dollar in the last few years, with continued adoption, it will also change for Ethereum.
Inflation Costs
The other major cost to money that we are going to consider is inflation caused by changes in money supply. Money is used as a means of transaction and most people hold money rather than a physical good or investment in anticipation that they will need to partake in commerce. However, there is an implicit cost to having money rather than other assets that is due to the decrease in purchasing power over time caused by an increase in the money supply, or inflation. What costs do we bear as the consumer for using US dollars compared to cryptocurrencies? The following is a chart showing the monetary base of the USD, Broad Money USD, Bitcoin and Ethereum over time.

Change in Money Supply
Unfortunately, due to a number of accounting tricks by the federal reserve, it is difficult to precisely ascertain which metric of money supply is most apt to compare Bitcoin and Ethereum. I initially used the reported inflation rate, but as some astute readers pointed out this is not a very good metric namely due to something called the hedonic quality adjustment. The federal reserve uses this to try and reflect the fact that the quality of the goods we purchase is increasing overtime. Although a car is getting more expensive, it is due to improving quality, not just inflation. There is some merit to this argument, however, it is extraordinarily difficult to create a good way to measure qualitative changes. Therefore, it is really a lever, having nothing to do with money, which the federal reserve can use in a practically limitless and unknown way to under report actual inflation due to the change in money supply. So what is a more appropriate metric? One might be the monetary base, which is shown in green. The monetary base is the total amount of currency in circulation. This is a more apropos comparison to the Bitcoin and Ethereum supply, however doesn’t represent the full story. The reason it gets more complicated from here is that commercial banks can use deposits to create new loans on a fractional reserve basis. This means that if a bank gets a deposit for $100 they can now, per the federal reserve rules, originate $1000 in new loans. Furthermore, the deposits have an implicit guarantee against default backed by the FDIC or federal government. Therefore, since the reserve requirements are dictated by the federal reserve, and the deposits are insured by the government, total deposits is the effective change in money supply rather than the monetary base. The total “deposits” is known as broad money or M3 which is graphed in gray. The M3 money supply is likely the best metric to use in this comparison.
Presently, the annual rate of change in money supply for the dollar, Bitcoin, and Ethereum are 6.2, 4.0, and 7.8% respectively. Bitcoin’s monetary policy is deterministic and fixed as part of the Bitcoin protocol. Therefore, we know exactly what the inflation rate will be in the future as it eventually approaches zero when all 21M Bitcoin are mined. Due to this we can see that Bitcoin will be well below the 30-year average rate of change of the US dollar money supply (M3) of 5.2% to 1.7% in June of 2020. Ethereum’s monetary policy is a little less clear and is changing based on community consensus. It has been stated that the goal is to bring Ethereum’s inflation rate to 0.5% in the future after the implementation of proof-of-stake, which will likely happen in the next 18 months.
Therefore, as of today, Bitcoin is the clear winner in terms of the cost of inflation. However, within the next 2.5 years both Bitcoin and Ethereum will have a much lower inflation rate than the dollar making them less expensive to hold and use as money.
Conclusions
In this analysis I have only focused on two intrinsic costs of money, transactions costs, and inflation costs. There are clearly other extrinsic costs associated with using money such as friction, fraud, finance, future value, and volatility. Hopefully, I will have the time to work on making a comparison of the extrinsic costs in the near future. Based on the above what conclusions can we draw? Bitcoin is cheaper for many transactions compared to the traditional methods, while Ethereum is cheaper for all transaction types. Bitcoin currently has the lowest inflation rate of 4% and a future inflation rate of 1.5% in the next 2.5 years. Additionally, the monetary policies of both Bitcoin and Ethereum are such that the inflation rate is already or will shortly be well below the historic average inflation rate of USD. This means that in terms of transactions costs cryptocurrencies are better than money and already have or will have lower inflation costs. Therefore, Bitcoin and Ethereum are significantly cheaper and more efficient form of money than the US dollar.!