Fourier Transformation and Representation of the Signal in a Frequency Domain
Do you know what does the word spectrum mean? Or how the Fourier transformation is connected with a popular service - Shazam?

So let's start with basic things. We are used to representing mathematical functions or signals in a time domain, where the signal "S" is represented by the function S(t) that characterizes the changing of its characteristics over time.
Some of you probably know that signals can be also represented in a frequency domain that shows how much of the signal is concentrated over certain frequency.
So let's talk more about the second approach and understand how useful it is.
Any arbitrarily complex waveform signal can be represented as a sum of simple signals and as the sum of simple harmonic vibrations, the totality of which is called the frequency spectrum of the signal.
There is a connection between the spectrum and its waveform: a waveform change leads to a change in its spectrum and, conversely, any change in the spectrum of the signal causes a change in its waveform.
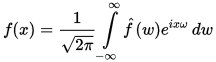
In order to get frequency-domain representation of the signal Fourier transformation should be applied to it:
, where i is an imaginary unit,
and conversely original function in the time domain can be reconstructed utilizing inverse transform:
Analyzing the signal in the frequency domain, you may notice patterns that are not visible in the time domain and vice versa if the signal has very complex spectrum probably it's easier to analyze it in the time-domain.
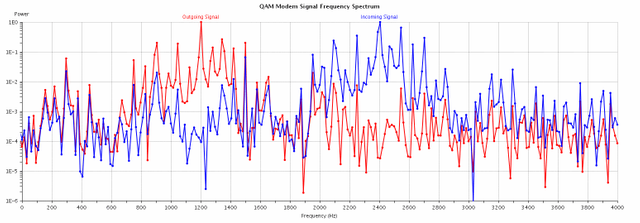
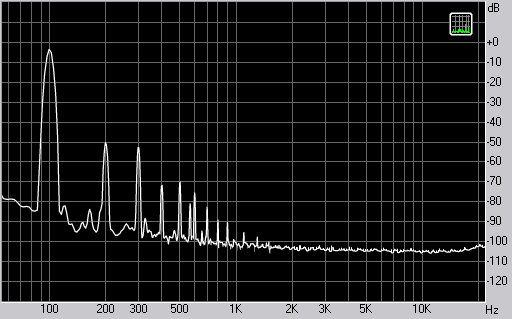
Spectrum - value distribution of the physical quantity (usually power or mass). A graphical representation of such a distribution is called a spectral diagram.
Since the spectral function  is a complex, then we can talk about the spectrum of amplitudes |f (ω)| and spectrum of phases F (ω) = arg (f (ω)). In some applications phase information is not relevant in and can be discarded. The spectrum of amplitudes is an important characteristic that shows how much of the signal is concentrated over a specific frequency.
Nice gif that demonstrates function representation in a time domain (red color) that is sum of sinusoids of different frequencies (blue color).
The physical meaning of the spectral function: the signal f (x) is the sum of an infinite series of harmonic components (sinusoids) continuously filling the entire frequency range.
Spectrum varies
1.By spectrum types:
Discrete or solid
Discrete is the spectrum in which the individual components can be
identifiedSolid is the spectrum in which it is impossible to separate the
individual components, as they are located so close to each other
that they merge
2.By frequency range of the spectrum:
Limited and unlimited
Limited is a spectrum in which all the signal energy is located in a
limited frequency range.Unlimited is a range in which all the energy of the signal is located
in an unlimited range of frequencies.
Another important term is Spectral waveform representation - a representation of the signal parameters in the form of two graphs:
- spectrum of amplitudes
- spectrum of phases
The spectral diagram shows the amplitude distribution of signal energy between the components of its spectrum. The base of the spectrum line on the frequency axis is at the point corresponding to the harmonic frequency. The lengths of the phases of the spectral lines are proportional to the value of the phases.
For example, if you will apply Fourier transformation to human speech it will be broken apart on tones of different frequencies that is sinusoidal waves of different amplitude and phase shifts.
Take a look at this video to better understand what is going on:
Summing up I would like to emphasize that Fourier transforms are an extremely powerful mathematical tool that formed the basis of entire digital signal processing theory. For example, frequency spectrum of the signal is widely used in electrical engineering when different digital devices are made.
In my next article, I will tell you how one of the most popular mobile apps Shazam use Fourier analysis and frequency domain to correctly detect a song that is currently played.
Follow me, if you are a geek like me or interested in technologies and scientific/educational topics
Alex aka @phenom
I've used Fourier transform stuff for processing natural systems information, like satellite images and streamflow time series. But natural systems seem, to me, to be not regular enough. I'm interested to see what you will say about Shazam. And I wonder if you have done much with wavelets?
I work a lot with digital signal processing as I develop navigation algorithms. Haven't used wavelets a lot yet, but I think there are few problems where I have yet to apply them
Great science post as usual :)
Thanks, @smailer. I like your creative coffee creatures too :)
Thanks for sharing about Fourier transforms. Definitely a very powerful tool.
thanks for reading. Follow my updates to learn more
I do not know if I will really learn anything new, but I will follow ^^
I've got some posts/ideas that require an introduction to Fourier transforms. I wasn't sure how to best introduce them, now I have something to link to!
That's great.
Feel free to cite this article and share your post with me at steemit.chat