Is More Downside In The Works For Ethereum?
After completing a “Head and Shoulders” formation on February 25th, Ethereum slid and on the 27th of the month, it hit support slightly below 214.00, a level marked by the low of February 11th. Then, it rebounded, but the recovery stayed limited near the 237.00 zone, slightly below the downside resistance line taken from the peak of February 24th. The fact that the price continues to trade below that line, as well as below the neckline of the H&S, suggests that the short-term outlook is negative.
At the time of writing, the crypto is trading slightly above the 214.00 zone. If the bears are willing to overcome that zone this time around, they may decide to push for the 194.00 territory, defined as a support by the inside swing peak of February 3rd. They may decide to take a break after hitting that hurdle, thereby allowing a small recovery. However, as long as such a potential recovery stays limited below the pre-mentioned downside line, we would see decent chances for the bears to take charge again and perhaps drive the battle below the 194.00 area. Such a dip may pave the way towards the 184.00 barrier, or the low of January 31st, at around 174.00.
Our short-term oscillators detect negative momentum and support the notion for some further near-term declines. The RSI, already below 50, has turned down again, while the MACD, even though above its trigger line, lies within its negative territory and shows signs that it could turn south as well.
In order to abandon the bearish case, we would like to see a strong move above the 255.00 zone. This way, the crypto will be, not only above the short-term downside line, but also above the H&S’s neckline. The bulls may then get encouraged to target the high of the right shoulder, at around 278.00, the break of which may lead to the peak of the head, at around 286.00. That said, in order to start examining whether the prior uptrend is back in force, we would like to see a decisive close above 286.00, as such a move would confirm a forthcoming higher high on the daily chart.
Ethereum 4-hour chart technical analysis 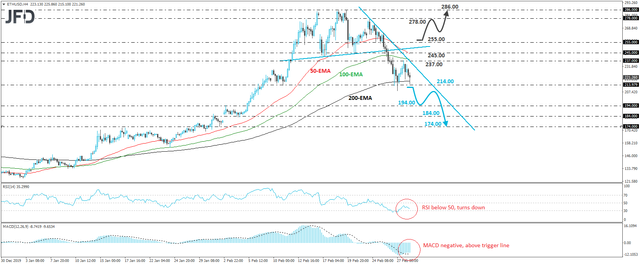 Ethereum 4-hour chart technical analysis