S&P 500 Futures Bounce As 10-Year Yields Head Slightly Higher
S&P 500 FUTURES
It has been a wild overnight trading session, with the S&P 500 Futures pointing to a flattish open at 3,126. The futures traded to as low as 3,091 and have bounced.
Interestingly that level isn’t the strangest place for the futures to have bounced. When I show you the first chart, you can see it.
S&P 500 Futures Daily Chart 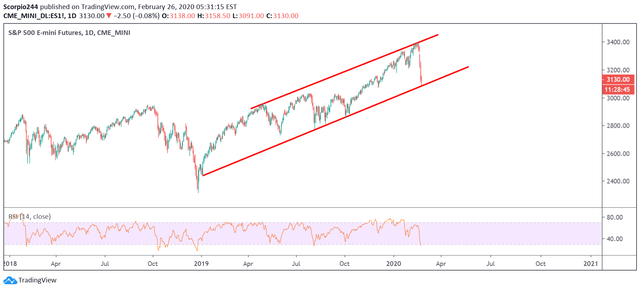 S&P 500 Futures Daily Chart
Pretty amazing. So we can see and hope. Levels, it all about levels and finding the ones the Algo’s are searching for.
US YIELDS
10-year yields are rising some this morning, finding a bounce off yesterday’s low, and are now trading around 1.37%.
US Govt Bonds 10 Yr Yield Chart 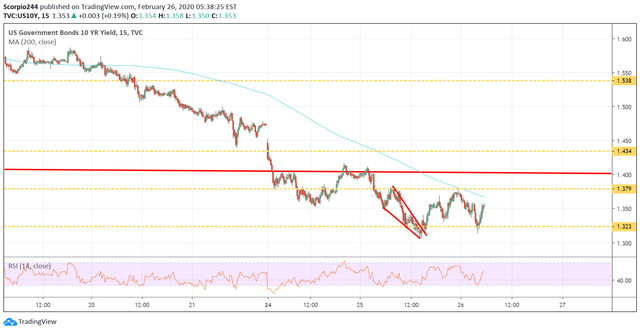 US Govt Bonds 10 Yr Yield Chart
DIAGEO (DEO)
Diageo (LON:DGE) came out and lowered its sales outlook for 2020 cutting net sales to a range of GBP 225 million to GBP 325 million. Yep, you know how much their net sales were in the first half of the year? GBP 7.2 billion.
Meanwhile, the stock here in the US had a $99 billion market cap on January 24, today, $89 billion. This on a sales decline of what amounts to around $420 million for a stock that trades at 5.2 2020 sales estimates of $17.1 billion. At that sales multiple, the revenue reduction should amount to a $2 to $2.5 billion hit to the market cap if you want to play it fairly.
Diageo Daily Chart 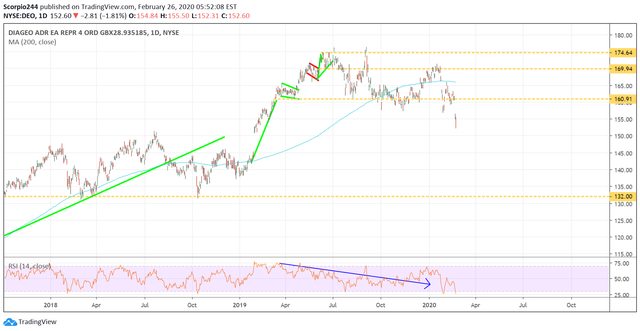 Diageo Daily Chart
TESLA (TSLA)
Tesla (NASDAQ:TSLA) is falling today after it was announced it was ending its solar cell partnership with Panasonic. The stock is trading at support at $760. Remember, the company priced the secondary deal an eternity ago at $767.
Tesla Chart 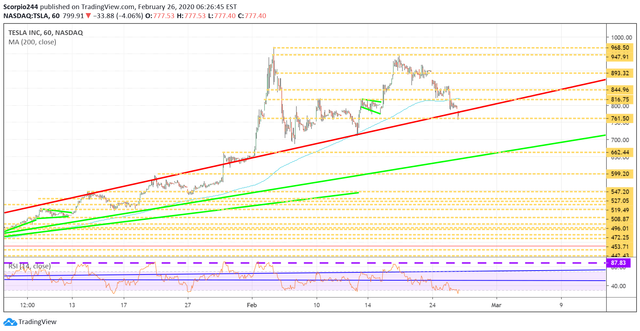 Tesla Chart
ACADIA (ACAD)
ACADIA (NASDAQ:ACAD) will report results tonight, and its stock has fallen by around 15.5% on the coronavirus fears. Oh right, they don’t sell Nuplazid outside the US. At least recently, the stock has found support around $40.85.
Acadia Inc Chart 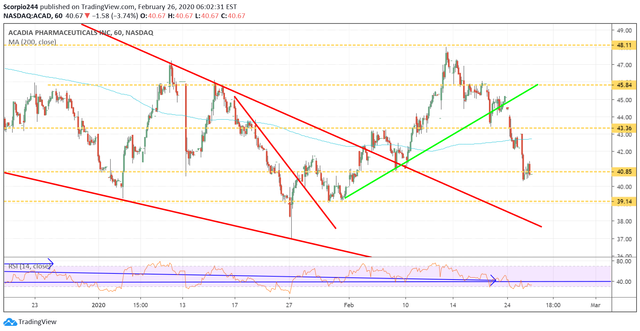 Acadia Inc Chart
ROKU (ROKU)
I’ll be watching Roku (NASDAQ:ROKU) today, and not because I think it is going lower, but because I think it may be going higher. The stock has done well in the last couple of days despite the sell-off.
Roku Inc Chart 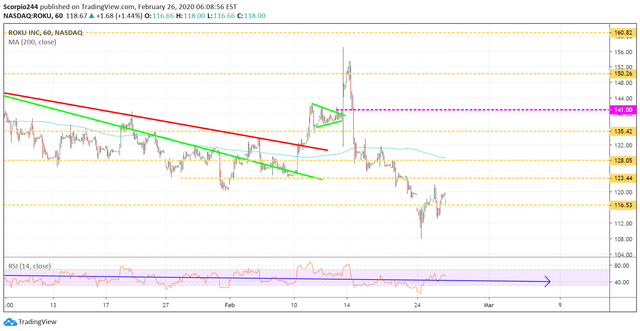 Roku Inc Chart
NETFLIX (NFLX)
Netflix (NASDAQ:NFLX) has been hanging around the $360 region, and so this needs to continue to hold. Besides, if everyone staying home, they have to do something, binge-watching sounds good.
Netflix Inc Chart 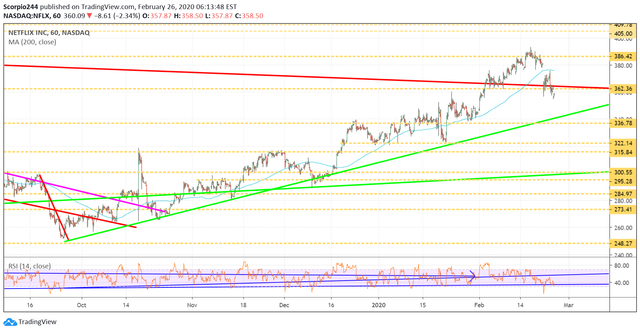 Netflix Inc Chart