Equity Bloodbath Continues As Coronavirus Fears Keep Heighten
The financial world continued trading in a panic mode, with equities extending their free fall, and safe havens keep attracting flows. That said, the dollar was lower against most of the other G10s for another day, perhaps due to fears that the US will not prove immune to the coronavirus’s economic effects.
STOCK MARKETS CONTINUE TO PLUNGE ON VIRUS FEARS, FED-CUT BETS INCREASE
The dollar continued trading lower against most of the other G10 currencies on Tuesday and during the Asian morning Wednesday. It lost ground against GBP, JPY, CHF, EUR and CAD in that order, while it gained only versus AUD, NZD and NOK. The greenback was found virtually unchanged against SEK.
USD performance G10 currencies 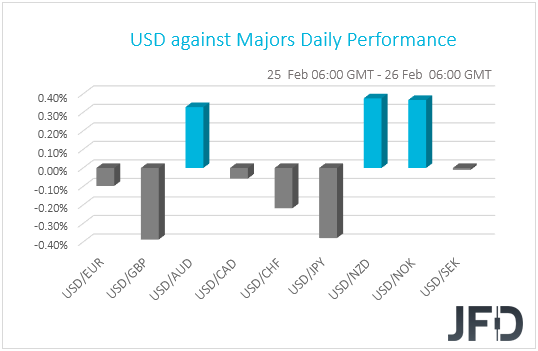 USD performance G10 currencies
This time, the performance in the FX world gives us a better taste over the broader market sentiment, suggesting that investors continued abandoning risky assets in favor of the safe havens. Indeed, major EU indices extended their Monday slides, with most of them recording loses of around 2%. The equity free fall accelerated during the US session, with the S&P 500 and Dow Jones losing more than 3% in their fourth consecutive red day. Nasdaq declined 2.77%. The negative investor morale rolled over into the Asian session today as well, with Japan’s Nikkei and China’s Shanghai Composite sliding 0.79% and 0.83% respectively. Hong Kong’s Hang Seng fell nearly 1%, while South Korea’s KOSPI gave back its Tuesday gains, falling 1.20%.
Major global stock indices performance 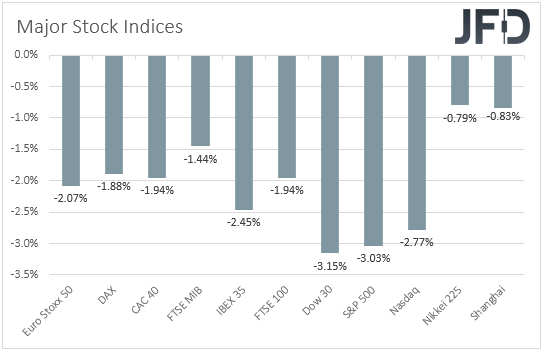 Major global stock indices performance
It seems that fears over a fast spreading of the coronavirus outside China kept growing, with South Korea reporting that the number of cases surged to 1146. In Italy, 12 people lost their lives, while 270 are confirmed to be infected. Austria reported two positive cases, while Croatia had also its first infection. On top of that, the US Centers for Disease Control and Prevention warned yesterday that citizens should be prepared for a spread in the US, adding to fears that virus will evolve into a global pandemic. To make things worse, a US official said that it will take at least 12-18 months for a coronavirus vaccine to be developed, while in Japan, there have been reports regarding the possibility of canceling the Tokyo Olympics, planned to start in July.
All these developments add further credence to our view that the effects of the virus may not prove as temporary as many initially believed and that the economic wounds could well drag into Q2. With the spreading outside China appearing to be out of control at the moment, and with the world’s largest economy signaling that it is not immune to the virus, we believe that there is still room for equities to keep sliding, and safe havens to attract flows. Even the yen, which last week tumbled on concerns that the Japanese economy is headed towards a recession, wore its safe-haven suit again, staying among the top G10 performers for a second consecutive day.
As far as the dollar is concerned, it continued trading on the defensive side, perhaps due to fears that the US will prove to be no exception, and that it will also feel the burden of the coronavirus’s effects. This is also evident by the US Treasury yields, the 10-year of which hit a new record low, widening its spread with the three-month yield to -20bps.
US Treasury yield curve 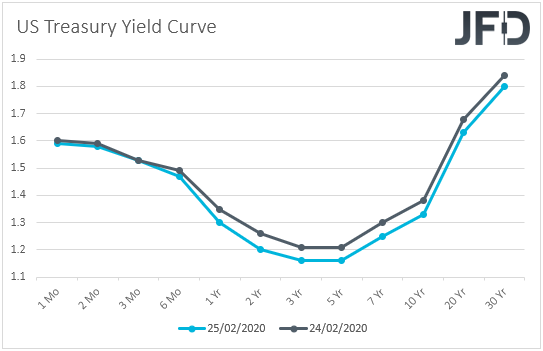 US Treasury yield curve
What’s more, although Fed Vice Chair Richard Clarida and Dallas Fed president Robert Kaplan noted that current rates remain appropriate, investors remained unconvinced and they are still pricing more than two quarter-point reductions by the end of the year. They are now more than fully pricing in one for June and another one for September. Clarida repeated Powell’s words that policy is not in a preset course, and that the Fed will proceed meeting by meeting, which gives market participants the right to believe that if the virus keeps spreading at a fast pace, the Fed will eventually be forced to act.
Fed funds futures market vs FOMC interest rate expectations 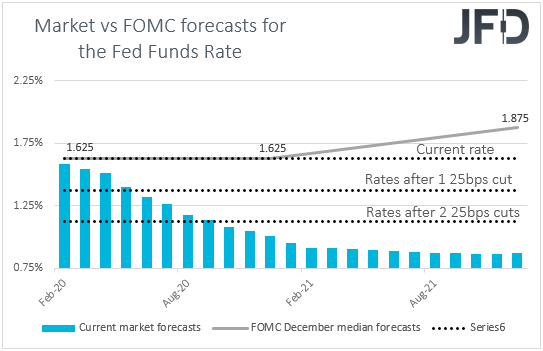 Fed funds futures market vs FOMC interest rate expectations
In our view, the dollar may continue drifting south for a while more, due to increasing expectations of Fed cuts, but we prefer to exploit such weakness against the safe-haven Swiss franc. We are still reluctant to trust the yen, as fresh fears over the course of the Japanese economy could once again make it forget its safe-haven status. Against the Aussie and the Kiwi though, we still expect the greenback to be the winner as the risk-linked currencies are likely to suffer more on further spreading, as the Australian and New Zealand economies are largely reliant on the Chinese one.
DJIA – TECHNICAL OUTLOOK
It was another big red day for the stock market yesterday, where the DJIA was no exception, as it closed down around 3%. From the technical side, the index drifted and ended the day below a medium-term upside support line drawn from the lowest point of August 2019. In addition to this, the price closed below the lowest point of December on the cash index, which is at 27319. Although we may get an attempt by the bulls to take advantage of the lower price and lift the index a bit higher, still, if it remains below that upside line, any move higher may be seen as a temporary correction before another leg of selling. Hence, we will stay bearish for now.
Another slide might bring the price to the 26912 hurdle, which is the low of October 31st. The index could stall around there and given that it had already declined heavily over the past few days, we may see a small correction, possibly leading DJIA back to the above-mentioned December low, at 27319. If the bulls find it difficult to push the index above that barrier, this could result in another round of selling, potentially aiming for the 26912 obstacle again, a break of which would confirm a forthcoming lower low and more sellers might join in. That’s when we will target the 26629 level, marked by the low of October 23rd.
Alternatively, if the price suddenly climbs back above the aforementioned upside line and gets pushed above the 27714 area, which is the low of December 10th, this might attract more buyers back into the game. In addition to that, the index would be back above its 200-day EMA, which may help DJIA to resume the previous strong uptrend. That’s when we will aim for the 28158 zone, which is the low of January 31st. The price may stall there temporarily, but if the bulls see it as a temporary obstacle and break it, such a move could clear the way to the 28767 level, which is the current high of this week.
Dow Jones Industrial Average daily chart technical analysis 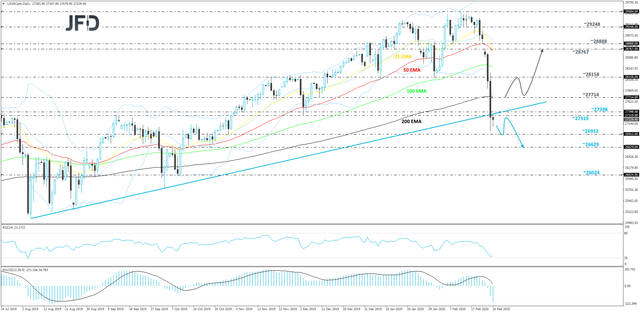 Dow Jones Industrial Average daily chart technical analysis
USD/CHF – TECHNICAL OUTLOOK
After peaking around mid-February, USD/CHF started moving lower and is now trading below a short-term downside resistance line taken from an intraday swing high of February 20th. We can see that the pair seems to be oscillating around its 200 EMA on the 4-hour chart. Although the near-term trend is currently to the downside, in order to get comfortable with lower areas, we would like to see a break below the current low of this week first, which is at 0.9751. For now, we will remain somewhat bearish.
Eventually, if we do see a drop below the 0.9751 hurdle, this would confirm a forthcoming lower low, which could mean that the current downtrend might continue. That’s when we will aim for the 0.9740 hurdle, a break of which might open the door for a further push south, potentially targeting the 0.9713 level, marked near the high of January 31st and near an intraday swing low of February 5th.
On the other hand, if the aforementioned downside line breaks and the pair travels back above the 0.9791 barrier, which is yesterday’s intraday swing high, this could lead to a change in the short-term trend, possibly leading the rate towards slightly higher areas. We will then target the 0.9805 obstacle, which if broken may clear the path to the 0.9815 zone, marked by this week’s high. Initially, USD/CHF could stall around there for a bit, but if the buying continues, another push higher might bring the pair to the 0.9831 level, marked by an intraday swing low of February 20th and an intraday swing high of February 21st.
USD/CHF 4-hour chart technical analysis 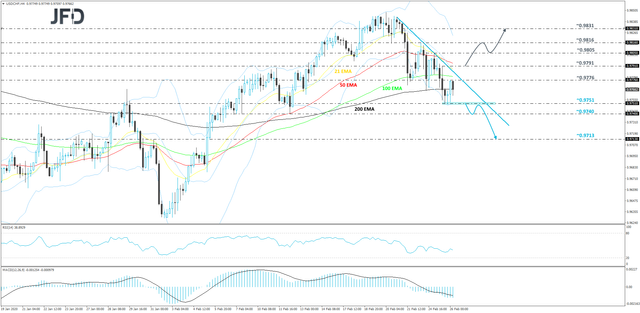 USD/CHF 4-hour chart technical analysis
AS FOR TODAY’S EVENTS
The calendar is very light today, with the only releases worth mentioning being the new home sales for January and the EIA (Energy Information Administration) weekly report on crude oil inventories for last week. With regards to the US new home sales, the forecast has changed and now suggests a 3.5% mom increase after a 0.4% slide in December. As for the EIA report, expectations are for a 2.467mn barrels increase after a 0.414mn barrels inventory build previously. That said, bearing in mind that the API report revealed a 1.300mn increase, we see the risks of the EIA forecast as tilted somewhat to the downside.
As for tonight, during the Asian morning Thursday, we get New Zealand’s trade balance for January and the nation’s ANZ business confidence index for the same month. No forecast is available with regards to the trade data, but the ANZ business confidence index is forecast to have risen, but to have stayed within the negative territory. Specifically, it is expected to have increased to -7.9 from -13.2. However, bearing in mind that the coronavirus was yet to spread to the extent it did this month, we prefer to wait for the February data, in order to get an idea whether businesses in New Zealand have felt the heat of the virus’s effects.
Daily Market Review: Equity Bloodbath Continues as Coronavirus Fears Keep Heightening