Is This A Repeat Of The February 2018 Market Crash?
Back in early 2018, after a dramatic rally in early January 2018, the U.S. stock market collapsed suddenly and violently – falling nearly 12% in a matter of just 9 trading days. Our researchers asked the question, is the current collapse similar to this type of move and could we expect a sudden market bottom to setup?
Although there are similarities between the setups of these two events, our researchers believe there are two unique differences between the selloff in 2018 and the current selloff. We’ll attempt to cover these components and setups in detail.
S&P 500 Emini Futures Globex Daily Chart 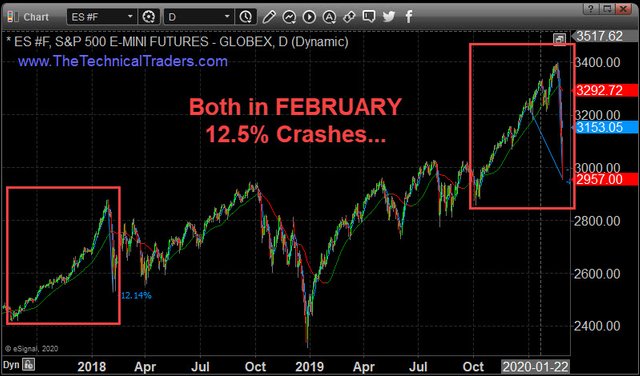 S&P 500 Emini Futures Globex Daily Chart
FIRST, THE SIMILARITIES:
The contraction in market price just before the end of the year in 2017 was indicative of a market that had rallied to extended valuation levels, then stalled in December as the year-end selling took over.
The renewed rally in early January was a process of capital re-engaging in the market as future expectations continued to drive and exuberant investor confidence in the markets.
These two similarities between 2018 and 2020 seem fundamental.
Yet, there are differences that may drive a further price contraction event — beyond what we saw in 2018.
The U.S./China trade deal disrupted market fundamentals over the past 6+ months and established a more diminished function of global economics as the trade tensions continued
The foreign market capital shift process, where foreign capital poured into the U.S. stock market over the past 12+ months and supported the U.S. dollar was a process of avoiding foreign market risks. This process trapped a large portion of foreign capital in the U.S. markets prior to the 2020 collapse.
Global geopolitical functions are far more fragile than they were in 2018. After Brexit was completed and prior to the signing of the U.S./China trade deal, a number of concerns existed throughout the world and are still valid.
The Wuhan coronavirus has changed what global investors expect and how both supply and demand economic functions are being addressed world-wide.
The potential of an early price bottom setting up after this 2020 price collapse is very real. Yet, the ultimate bottom in the markets may be much lower than the 11% or 12% price decline that happened in 2018.
The scale and scope of the coronavirus event, should it continue beyond April 2020 (and possibility well into June or July 2020), could extend the price decline even further. Ultimately, this extended risk function may push the U.S. and global markets to deeper lows before a bottom sets up – yet the outcome may be very similar.
After the double bottom in 2018 setup, a slow and steady price advance continued until the SPY (NYSE:SPY) price rallied to new highs in September 2018. A very similar type of price activity may take place in 2020 after the ultimate bottom in price sets up.
S&P 500 ETF Daily Chart (2017-2018) 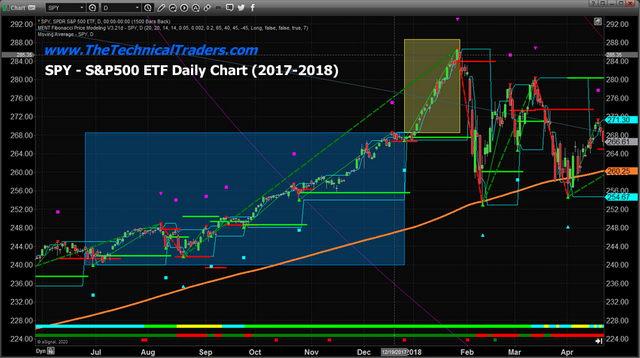 S&P 500 ETF Daily Chart (2017-2018)
Our researchers believe the ultimate bottom in the SPY) will likely happen near $251 – near the middle of the 2018 price range. Ideally, the event that takes place to create this price decline will likely happen in a “waterfall” event structure. This means we may see a series of 3 to 9+ day selloffs culminating in a major market bottom near $251.
If our research team is correct in this analysis, a bottom will likely form in the SPY and near $251 to $265 where an extended bottom pattern may setup. We may see a double-bottom type of pattern as we saw in 2018.
Ultimately, we believe the bottom will setup sometime in mid-2020 and the remainder of the year will continue to support an extended price rally into the end of 2020.
S&P 500 ETF Daily Chart (2019-2020) 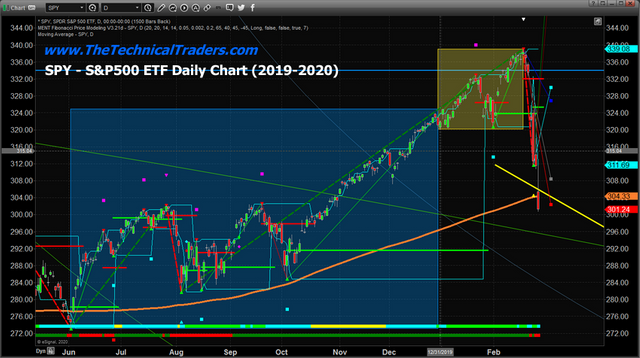 S&P 500 ETF Daily Chart (2019-2020)
Are we looking at a similar type of price event like we saw in early 2018? Ideally, yes. Although, we believe this downside price move will be deeper in terms of the total price decline (likely 18% to 25%) and will end when price valuation levels reach a point where global investors feel opportunity exists beyond risk.
Right now, we believe a massive opportunity for skilled investors is present and that incredible market sector price rotations are taking place. We believe the devaluation process will move the markets lower by at least 15% to 20% or more.
That suggests the bottom in the SPY is likely near $251 before we see any real opportunity for price to form a support base and begin to rally higher.
As a technical analysis and trader since 1997, I have been through a few bull/bear market cycles. I believe I have a good pulse on the market and timing key turning points for both short-term swing trading and long-term investment capital. The opportunities are massive/life-changing if handled properly.