Emini February Rally Might Be Bull Leg In Trading Range
30 YEAR TREASURY BOND FUTURES MARKET:
TESTING OCTOBER HIGH, BUT WEDGE RALLY
Bond Weekly 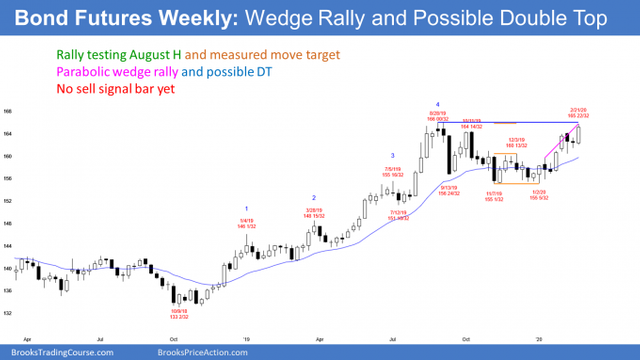 Bond Weekly
The 30 year Treasury bond futures has rallied in February to near the August all-time high. However, the rally comes after 4 consecutive bear bars on the monthly chart (not shown). When that is the case, there is usually at least a small 2nd leg sideways to down.
On the weekly chart above, the rally from the January 2 low now has 3 legs up. It is therefore a wedge. A wedge tends to attract profit takers. This is especially true when the wedge rally is testing a prior high. The 2nd leg up in a double top often is a wedge.
There is no top yet. Also, this week closed near its high. Finally, the 3rd leg up in the wedge could easily go several points above the top of the 2nd leg before there is a reversal down. Consequently, the bond futures will probably go at least a little higher. But because of the wedge and the top of a 7 month range, probably not much higher before there is at least a minor reversal down.
EUR/USD WEEKLY FOREX CHART:
PARABOLIC WEDGE SELL CLIMAX DOWN TO THE APRIL 2017 GAP
EUR/USD Weekly Chart 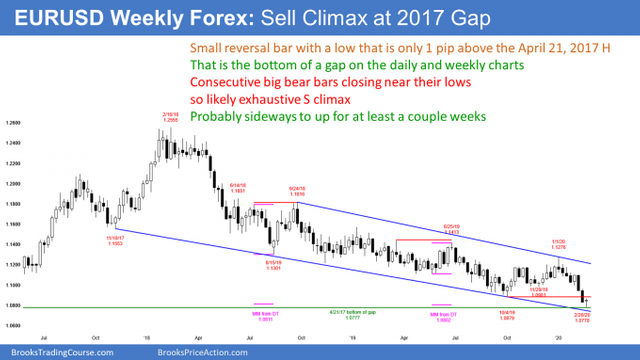 EUR/USD Weekly Chart
The EUR/USD weekly Forex chart has sold off strongly for 2 weeks. I have mentioned the gap above the April 17, 2017 high many times over the past 6 months. I said that the EUR/USD might have to test the gap before the bulls could regain control.
Thursday’s low was 1 pip above the April 17 high. The bulls want a successful test. That means a reversal up from the gap.
However, the bears want the test to fail. Instead, the want the EUR/USD to continue down to the next support, which is the 2017 low. That was the bottom of a yearlong strong rally.
If the bulls can get a reversal up from above that low, they will see the 2 year selloff as a bull flag on the monthly chart (not shown). However, if the bears get a break below that low, the bull case will be over. The bulls need higher lows. A break below that low would be a lower low. The bulls would then have to start over in their attempt to get a bull trend reversal.
Can the selloff continue down to par?
Not only do the bears want a break below the 2017 low, they want the selloff to continue down to par (1.00). The momentum down over the past few weeks has been exceptionally strong. That increases the chances for the bears. But the support at the gap and the 2017 low are also strong. Until the bears get their breakout, it is still more likely that the bulls will get a reversal up from above the 2017 low.
Parabolic wedge sell climax on daily chart
EUR/USD Daily Chart 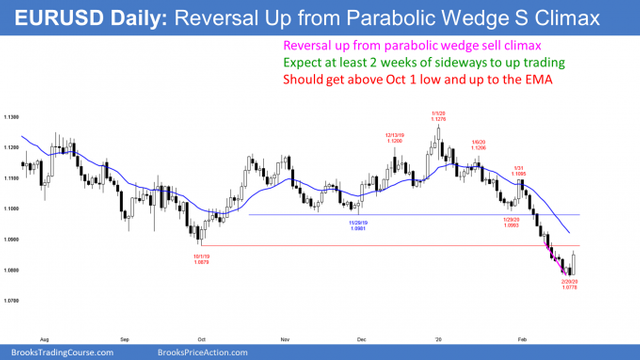 EUR/USD Daily Chart
The EUR/USD has been in a free-fall on the daily chart for several weeks. The stop for the bears is now far above. Many bears will want to reduce their risk.
The easiest way is to buy back some of their shorts. When the sell climax is extreme like it is on the daily chart, the short covering typically has at least a couple legs sideways to up. Also, it usually lasts 10 bars or more. Therefore, traders are looking for about a 100 – 200 pip rally for a couple weeks. It probably began Friday.
Wednesday was the 3rd pause in the selling in 7 days. Three legs down in a tight bear channel is a parabolic wedge sell climax. The bulls are hoping that Friday’s bull trend bar was the start of the short covering rally. The EURUSD got to within 1 pip of closing the gap and there is a parabolic wedge selloff down to that support. There was a strong rally on Friday. Many bears are beginning to take profits and bulls are starting to buy.
If the bulls can create one or two more big bull bars on the daily chart, traders will conclude that the EUR/USD has begun at least a couple weeks of short covering. But if the bears get a couple closes below this week’s low, especially far below, traders will expect the selloff to continue down to the 2017 low.
MONTHLY S&P500 EMINI FUTURES CHART:
BREAKOUT ABOVE THE JANUARY HIGH
Emini Monthly Chart 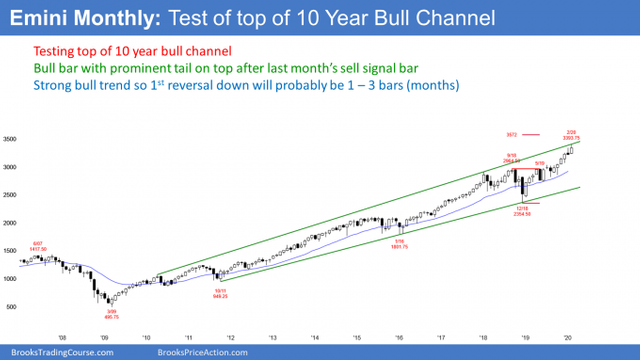 Emini Monthly Chart
The monthly S&P500 Emini futures chart rallied strongly in February. It is now testing the top of its 10 year bull channel. There is currently a prominent tail on top with one week left to the month. That is a sign that traders see the channel as resistance.
January was a sell signal bar. Instead of falling below the January low and triggering the monthly sell signal, the Emini rallied to above the January high. The bulls want a close above the January high. That gap between the close of the month and the January high could lead to some kind of measured move up. More likely, the Emini will stall at the top of the bull channel.
Friday closed only 1 tick above the January’s high. There is still a week left to the month. With the selloff on Thursday and Friday, it is more likely that February will close below the January high.
As I have said many times over the past few weeks, I think the Emini is in a bull leg in a trading range on the daily chart. The range began around Christmas. The Emini will probably trade down to at least the February 10 low within a few weeks.
Support and resistance at the end of the month
What has that daily chart got to do with the monthly chart? Well, this coming week is the final week of the month. Traders will therefore look for the Emini to gravitate to monthly support or resistance at the end of the week. This is especially true for the final hour of the week.
Currently, the most important magnet is the January high. If the bulls can get the month to close above that high, the odds of higher prices in March would be better. But if the bears can get February to close below the January high, traders will wonder if the rally is stalling. That would increase the chance of sideways trading in March.
Can February close down at the January low? Unlikely. That low is far below and there is only one week left to the month. But if the Emini sells off strongly down to that low, February would have formed a micro double top with January. That would increase the chance of lower prices in March.
2020 will probably be in a range from 2900 to 3500
Last year was a huge bull bar on the yearly chart (not shown, but on a yearly chart, each bar is one year). It came late in a bull trend. It is therefore likely exhaustive. Traders should expect a neutral bar in 2020.
One example would be a bar with a smaller range and a close around the open. If this year is a doji bar on the yearly chart and it has a smaller range, the 1st 2 months might have covered most of the range for the year. Or, if the Emini reverses down, the rally might be making the tail on the top of a doji bar or bear reversal bar.
I have said several times since December that 2020 might form a big trading range between 2900 and 3500. I still think this is true. The Emini is getting close to the top of that range. This tends to limit the upside from here.
WEEKLY S&P500 EMINI FUTURES CHART:
LOW 2 TOP AT TOP OF BULL CHANNEL
Emini Weekly Chart 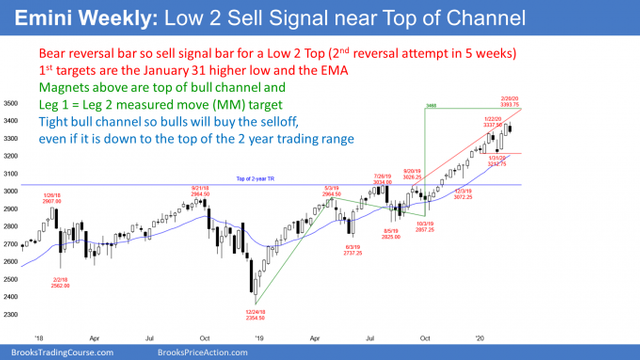 Emini Weekly Chart
The weekly S&P500 Emini futures chart formed a bear reversal bar this week after 2 big bull bars. Those 2 big bull bars came late in the bull trend that began in October. This is the 2nd 2-bar buy climax in the past 6 weeks. There are now consecutive buy climaxes, which increases the chance of a pullback.
This past week is a sell signal bar for the coming week. There is now a Low 2 top at the top of the bull channel. Next week should trade below this week’s low. That will trigger the weekly sell signal.
Because the context is good, there will probably be more sellers than buyers below last week’s low. This means that traders should expect lower prices over the next couple of weeks.
Exhaustive buy climax
Whenever there is an usually big bull bar or a pair of reasonably strong bull bars coming late in a trend, the rally usually attract profit takers. If enough bulls cover their positions (sell out of their longs), the Emini could reverse down for several bars. If it does, the first magnets below are the EMA and the bottom of that final bull breakout.
The rally to the January 22 high is an example. I talked about this at the time and said that there would probably be a 5% pullback. The Emini sold off 4% over the next 2 weeks.
A more dramatic example is the rally to the January 26, 2018 high. At that time, I said that the Emini would likely correct 5 – 10% beginning within a few weeks. It sold off 10% over the next 2 weeks.
Consecutive big bull bars but not very climactic
There are again consecutive big bull bars and now a sell signal bar. There are some differences from the other 2 examples. The first is the strong sell signal bar this time. Also, it is a 2nd reversal attempt, and 2nd signals have a higher probability of success.
However, the bulls have some hope as well. The 4% correction 3 weeks ago relieved some of the overbought condition. Traders sometimes think of the pullback as an opportunity for exhausted bulls to recover their energy during that selloff. That renewed energy makes them more willing to buy again.
Because there was a relief from some of the exhaustion after that selloff in late January, the bulls are theoretically less exhausted now. The bulls are less overextended. This reduces the chance of panic profit taking and a sharp reversal down.
However, the general idea is the same. Unusually strong bull bars late in a bull trend typically attract profit takers. Consequently, there is an increased chance of a pullback within the next few weeks. The bears now have a reliable setup. Traders should expect at least a couple weeks of sideways to down trading.
If there is a selloff, the 1st targets are the EMA and the bottom of the most recent buy climax. That is the low of 3 weeks ago. The next support is the January low at the bottom of the 2 month trading range.
Leg 1 = Leg 2 measured move target at 3460
What is the alternative to a selloff? It could be that this week was simply a pause in the rally from the January low. The bulls are hoping that the bull trend from the October low is resuming. They want this rally to reach the Leg 1 = Leg 2 measured move target at 3468. A couple closes far above the 3400 Big Round Number would shift the probability in favor of the bulls.
The next target would be the top of a broader bull channel on the weekly chart. That is currently around 3520.
DAILY S&P500 EMINI FUTURES CHART:
FEBRUARY RALLY MIGHT BE BULL LEG IN TRADING RANGE
Emini Daily Chart 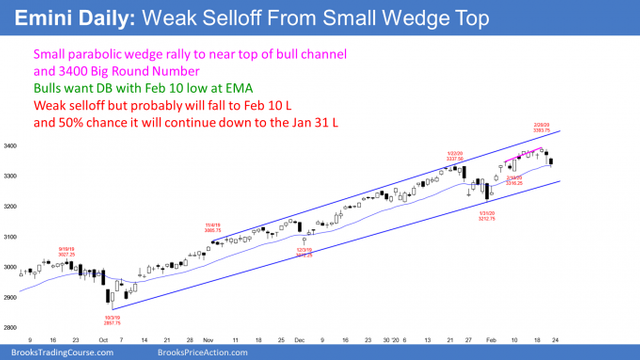 Emini Daily Chart
The daily S&P500 Emini futures chart has rallied strongly in February. But the rally had 3 legs up in a tight bull channel. That made it a parabolic wedge. Since that is a type of buy climax, it often attracts profit takers. The bulls took some profits on Thursday and Friday. Will they take more?
Traders are uncertain if the February rally is a resumption of the 5 month bull trend or simply a bull leg in a trading range that began around Christmas. They should get information over the next couple weeks that will help them decide which is more likely. I think a trading range is a higher probability bet, especially after the strong selloffs on Thursday and Friday.
The bulls want a resumption of the 5 month bull trend
If the bulls get a couple closes above the 3400 Big Round Number, the odds will shift in favor of the bulls. Traders will be more inclined to think that the October to January bull trend is resuming.
They would then expect the rally to continue up to the top of the bull channel on the daily chart. That is currently around 3440. In addition, they would look for the rally to reach the 3468 Leg 1 = Leg 2 measured move target on the weekly chart.
The bears want a test of the January low
After the 4% correction in January, traders know that the bears can take control. Also, they are uncertain if the exhausted bulls fully recovered during the late January pullback. Are the bulls willing to buy aggressively at the high? Or, have they become more cautious? Are they now only willing to buy pullbacks?
The Emini went up and down in January. Therefore, it was sideways. It has broken above the January high, but it has gone sideways for 2 weeks. This week was a doji bar on the weekly chart after 2 climactic bars.
These factors tend to limit the upside from here. Also, if the year is going to be in a trading range, there will probably be several smaller ranges within the yearlong range. Christmas is a reasonable candidate for the start of a range. The price action since then is consistent with this. The Emini will probably be sideways to down over the next week and possibly down over the next month.
The downside targets are the bottom of the bull channel and especially the January low. There is currently a 50% chance that this selloff will continue down to that low by the end of March.