Stock Markets And Flu: Where's The Bottom?
The end of February was brutal for traders that were not prepared for the breakdown in the U.S. stock markets. The breakdown in price actually started on February 20 and 21. Most traders didn't pay attention to these minor downside price rotations in the Technology (NQ) and the Financial sectors. The early downside price rotations in key sectors gave traders a bit of a warning that the markets were starting to shift away from the earnings-driven rally that had set up the recent peaks.
The other item that concerned the markets was the spread of the coronavirus into Italy, Iran and other areas without known contact to areas of the virus origin. Obviously, there had to be some process of contact for the virus to spread – but there are concerns now that the virus could be active within various societies throughout the incubation period and spreading to people in densely populated cities in these areas. The idea of a “super spreader” event becomes very real if societies are not able to identify and contain the sources of these transmissions.
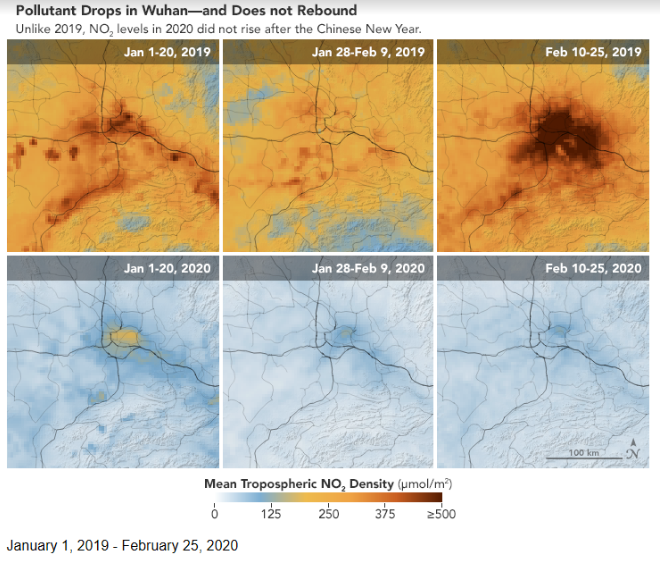
The fear that gripped the markets last week had been telegraphed for many weeks with the news and speculation that China and Asia were going to be hit with much weaker economic data in Q1 of 2020. Almost anyone with a bit of common sense should understand the economic complications associated with quarantining millions of people for well over 30+ days. Even environmental data (NASA) suggests the Chinese economic activity has collapsed in 2020.
It is time for traders and investors to come to the realization that a deflationary recession is likely given the scale and scope of the virus. Although the numbers pale in comparison to the common flu/cold, the economic implications are far more severe. As the virus spreads into the Middle East, Europe and Africa (think Belt Road Initiative) and early signs that it has already spread into parts of South America, one has to begin to wonder if this event could be something similar to Plague or Pandemic events of the past?
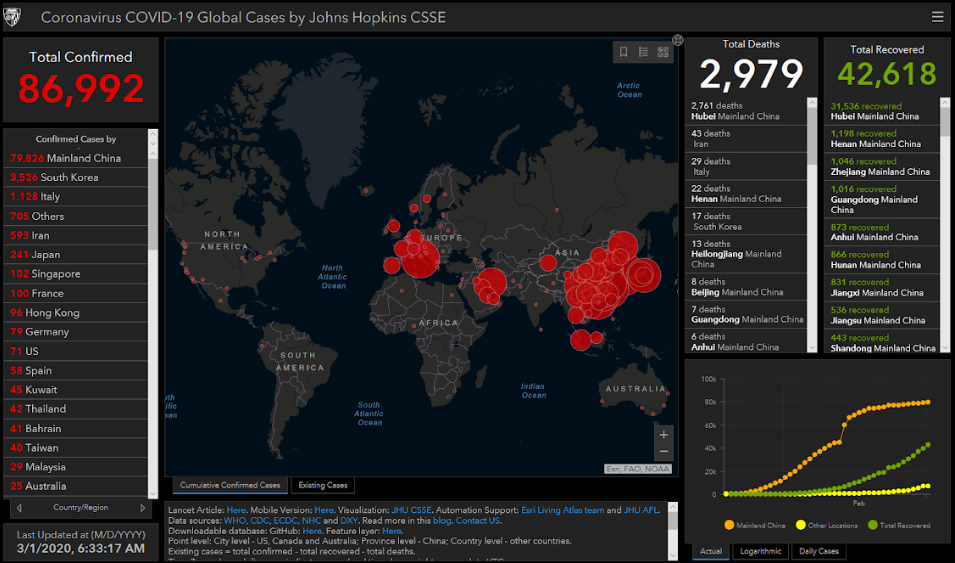
(Source: gisanddata.maps.arcgis.com)
As traders, we need to try to stay ahead of these events, attempt to predict where risks and opportunities will arise and work to protect our assets while attempting to trade within these market events. What happens if this event turns into an extended downside price rotation? What happens if, collectively, the global central banks can't support the markets as consumers globally move away from traditional spending and shopping activities? What are the longer-term implications of this event as it unfolds? Could this virus turn into a global deflationary depression?
There are a few positives we need to report originating out of the U.S. and Israel. News of a potential vaccine produced by a Texas firm and an Israeli firm has been announced over the past 10 days. Both firms believe they will be able to engage in human trials of these vaccines within a few weeks. Our advanced technology and computerized modeling systems allow us to respond to these types of events much faster than ever before. If these vaccines are successful and can be distributed in mass throughout the globe, we may see this virus come to a sudden, positive conclusion.
The other good news is that the coronavirus appears to be far less deadly than even the common flu or cold. Currently, the reported numbers are (roughly) 87,000 infected and 3,000 deaths. That results in a 3.4% mortality rate. The 2019 mortality rate for pneumonia and influenza was 6.9% (Source: cdc.gov/). The reality of the situation on the ground is that we will know more about these data points as we progress further in time. Numbers change as the total scope of the issue is determined.
Our objective is to protect capital and identify opportunities for profits. As horrible as it may seem to look at this global event and try to find ways to profit from it – that is really our main objective. We've been getting calls from friends and clients asking us “should I buy airlines and other sectors right now? This seeming like an opportunity to buy into this weakness.” Our answer is a bit more complicated as we are attempting to predict the future and we don't believe the bottom has setup/formed yet. The simple answer is “NO, you should not be buying into this weakness until we know a bottom has setup and risks to the global economy are more settled.”
Still, there are different opinions from institutional and private investors regarding the total scope of this event. UBS recently issued a BUY for “rich clients” to take advantage of this drop in prices in Chinese and Emerging Markets (Source: finance.yahoo.com). We don't agree with this analysis quite yet – unless you have a very deep threshold for risk and potential losses. Our research suggests the bottom will likely complete in May or June of 2020.
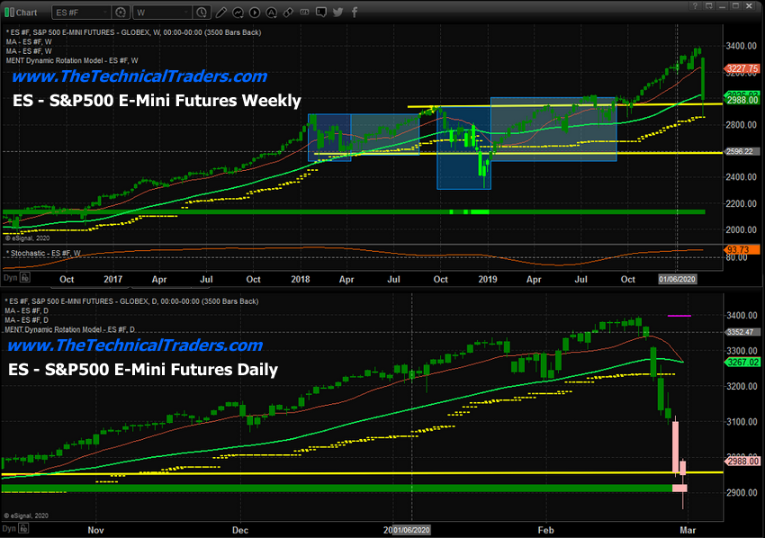
This ES chart highlights the downside rotation in price last week and the fact that our Dynamic Rotation modeling system is still suggesting the weekly trend has not changed to Bearish from Bullish. The fact is this downside price rotation is still above the YELLOW dashed line, which represents trend support. The daily ES, below the weekly chart, shows the Dynamic Rotation modeling system has already changed from a Bullish trend to moderate Bearish trend. Because of this, traders need to immediately protect open long positions and consider adjusting their portfolio allocations in preparation of extended downside price moves.
Our researchers believe the ultimate support level on the ES chart is near the $2590 level. Price may pause near the $2975 level as it coincides with previous tops in the market and identifies as moderate support. Yet we believe the ultimate support level is really near the $2590 level and that is the price this downside move will initially target.
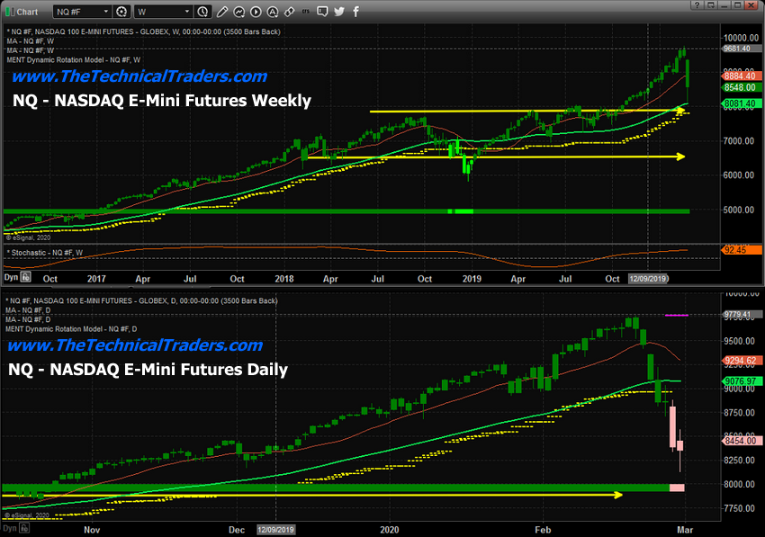
This NQ chart also highlights the immediate downside price rotation in the NASDAQ and how the weekly chart has yet to confirm any new bearish price trend. The weekly chart still shows confirmed bullish price trends and suggests the recent downside price rotation was within volatility ranges. The daily chart has already changed from a Bullish to moderate Bearish trend. Again, this suggests that traders should immediately try to lock in profits and prepare for any further downside price trends.
True support on the NQ chart is currently $6575. This suggests the NQ has another 2000 points to fall (-23.5%) before any real price support is found. Be prepared for this move.
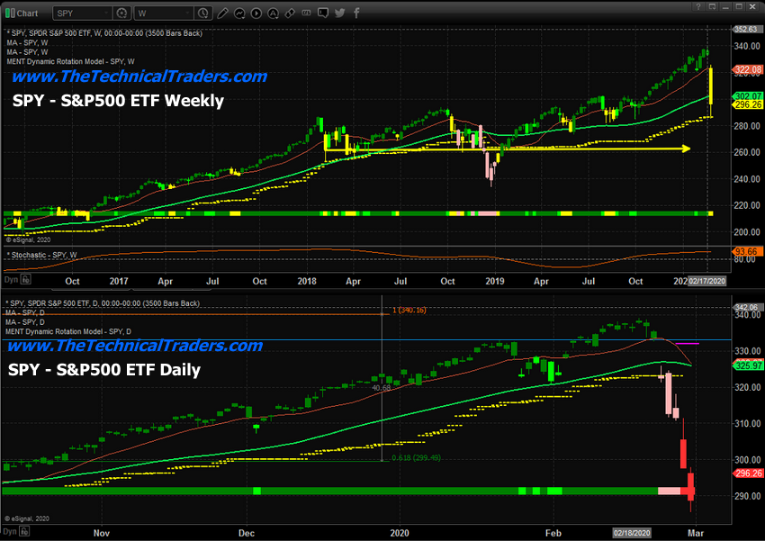
This SPY (NYSE:SPY) chart more clearly shows the scope of the downside price rotation. The weekly chart has already changed from GREEN to YELLOW – indicating a change in rotation price trend from Bullish to NEUTRAL on the weekly chart. The daily chart shows a trend change from Bullish to Moderate Bearish (Pink) to BEARISH (Red). This suggests the SPY price reaction has more clearly illustrated the risks of this downside price move and indicates that extended downside trending may continue.
Our ultimate support level for the SPY is near $262 – another $35 lower (-11.75%). If these ultimate support levels are reached, the total downside price rotation for all of these charts would total more than -20%. Certainly more than a simple 8-10% correction.