Candelsticks Part 2: Learning Heikin Ashi Candles
Hello everyone! I apologize for the delay. I know it's been a while since my last post, however, I am ready to get back into the Magick School in full force!
Today we are going to be covering part 2 of learning how to trade with candles. This lesson will cover trading with a different kind of candle, known as Heikin Ashi candles.
While the two candle types look similar to each other, they are functionally different and may serve different purposes. For a refresher, this is what a normal candle looks like:
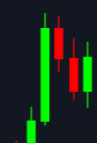
Looking at the image you can see two different types of standard candles, a bullish green candle, and a bearish red candle. The basic candle structure is based on "wicks" and "bodies". The wick either above or below the candle is the highest price or the lowest price that the asset you are trading has reached in the time period that the candle is showing. In this case, they are the high and low prices for a 24 hour period.
The "body" of the candle shows two prices and is the solid portion of the candle in the middle. The "opening" price, which is the price that the asset was trading on at the start of the candle time period, and the "closing" price, the price that the asset was trading on at the closing of the candle time period.
For a green candle, the opening price is at the bottom of the body and the closing price is at the top, while for a red candle the opening price is at the top of the body and the closing price is at the bottom. Here is a quick diagram to visualize this:
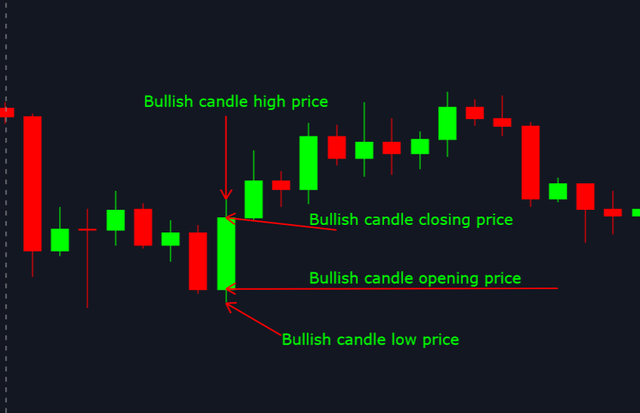
For red candles simply reverse the opening and closing price areas.
That covers the basic structure of the standard candles you will see on pretty much any trading chart. However, Heikin Ashi candles are different. Let's take a look at their structure:
A few things you will notice about the Heikin Ashi candles are their overall structure. They look almost the same as regular candles. They have a body and they have lines above and below them. However, there are some differences.
The first difference is how the math behind the candles is done. Rather than just having the opening, closing, high and low price of one time period like a regular candle does, Heikin Ashi candles show the average prices of the current time period as well as the previous candle period.
So, rather than having 1 candle showing a 24 hour time period, for example, you have one candle with the average prices of two 24 hour time periods.
Essentially this helps by smoothing out the price action on the chart and making trends and reversals easier to see than with more precise regular candles.
Also, the way the candles react to price action is different as well. On charts with standard candles, you almost always have wicks showing on the candle unless the price action is very strong in one direction or another. However, with Heikin Ashi candles you will regularly see candles that have either no upper wick or no bottom wick.
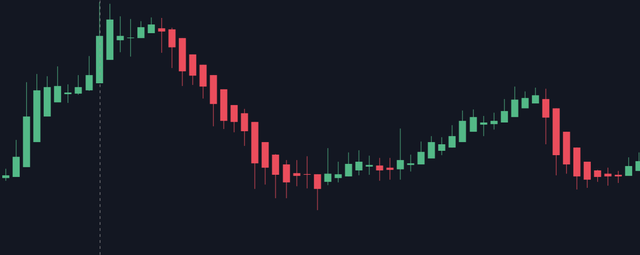
Let's zoom in and look at a couple of examples:
Here you can see a couple of areas on the chart where either the green candles have no lower wicks or the red candles have no upper wicks. This is a key feature of the Heikin Ashi candles that separates them from normal candles.
With Heikin Ashi, having no lower wicks on a green candle typically indicates a strong upwards trend or a buy signal. Having no upper wicks on a red candle usually means a strong downwards trend or a sell signal. Heikin Ashi candles with a wick both above and below the body of the candle, whether green or red, usually can be considered indecisiveness on whether prices want to go up or down, and may or may not signal a trend reversal.
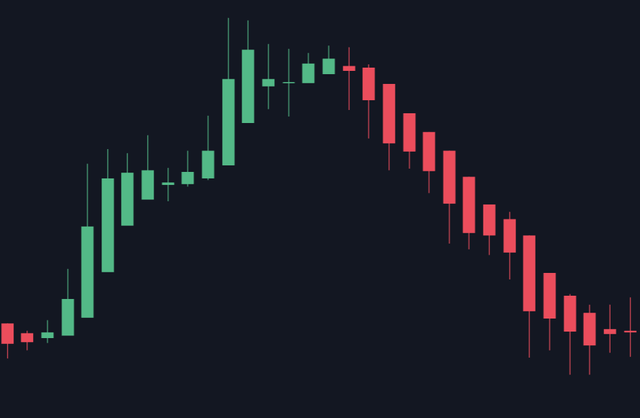
Let's break down the previous picture so we can visualize that information:
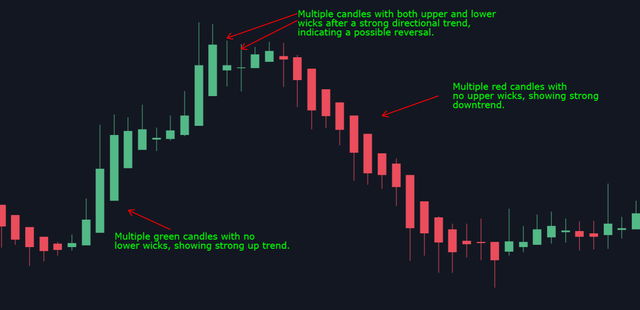
As you can see in the image the initial bullish trend, the possible reversal, and the strong downtrend following the reversal was clearly described by the candles. This is typically a much easier way to follow trends than with regular candles, which require many long hours of studying candle patterns to learn to read properly.
Speaking of candle patterns, you won't be using them with Heikin Ashi candles for the most part. Most of the candle patterns you may have learned studying normal candles just don't apply here, because of the way the candle structures are calculated. It's a bit of a trade off between being precise and to the penny on price action vs having an easier time spotting trends and potential reversals.
That being said, you can still use most charting tools or indicators with Heikin Ashi candles like you would for normal candles to support your theories on your chart trends. A good example of this is with the RSI, which is one of my favorite indicators that we will be covering in a different lesson.
Here is a quick comparison. First, normal 24 hour candles with the RSI:
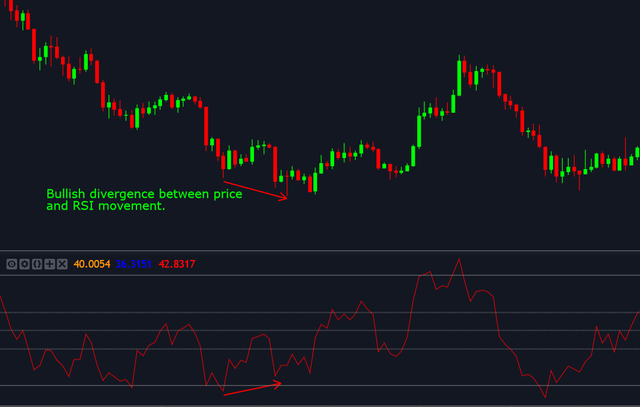
Here we see what a normal candle chart would look like on the 24 hour time scale if you were looking for a potential reversal. We can clearly see a bullish divergence happening when the momentum starts to shift for a potential reversal. This would have been a strong buy signal if you were using a normal chart.
Now for the Heikin Ashi version:
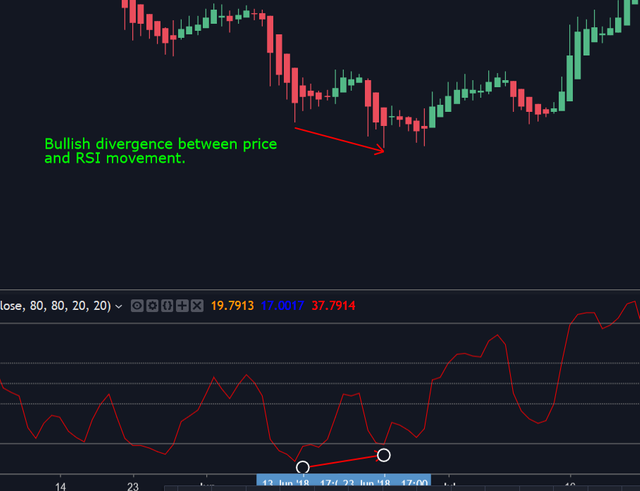
As you can clearly see the divergence still occurs for both regular candles and the Heikin Ashi candles. If anything the RSI is actually much smoother and easier to read than the more jagged version you see with regular candles.
Using the candle reading skills we just went over for Heikin Ashi and the RSI, we can see that not only do we have multiple candles after a strong downtrend that have both upper and lower wicks, but we also have a bullish divergence in price vs the RSI, after which the price for the asset started to rise.
You can see the opposite example of this slightly earlier in the chart when the downtrend started:
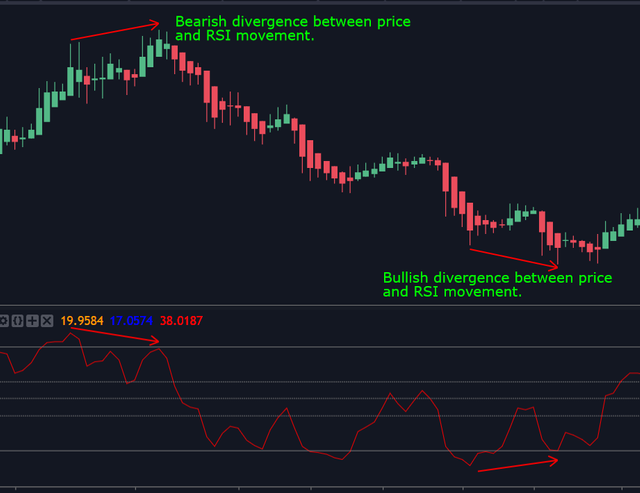
Essentially the combination of the Heikin Ashi candles and the RSI described a complete trend from the top to the bottom. If any trader had been able to place a buy and sell order anywhere within the range of the trend top or bottom, they would have been able to secure a decent amount of profit for their trade.
This particular trend is showing Bitcoin (BTC) from around $9,600 to the potential trend bottom at around $6,100. That's a lot of profit for one trend!
Now, there are a few downsides to using Heikin Ashi candles as well. It's not all Unicorns and Rainbows. As I previously described Heikin Ashi candles use averages, not precise opening, closing, high and low prices. This means that the prices described on the Heikin Ashi candles are not necessarily the current exact price that the asset is trading for on the market.
This means that, depending on the type of trader you are, you may not want to use Heikin Ashi candles if you are looking for exact entry and exit points on your trades.
But, if you are someone who doesn't necessarily care about getting the perfect entry or exit price and just want to catch the majority of the price trend for a buy or sell, then you may want to give Heikin Ashi candles a try. I certainly have liked using them more than standard candles since I don't have to worry so much about memorizing candle formations or patterns.
That pretty much covers it for the basics of using Heikin Ashi candles! If you have any questions or would like more information feel free to message me. I am always open to requests or criticisms.
Good luck traders!
Congratulations @magickmynd! You have completed the following achievement on the Steem blockchain and have been rewarded with new badge(s) :
Click here to view your Board
If you no longer want to receive notifications, reply to this comment with the word
STOPHello @magickmynd! This is a friendly reminder that you have 3000 Partiko Points unclaimed in your Partiko account!
Partiko is a fast and beautiful mobile app for Steem, and it’s the most popular Steem mobile app out there! Download Partiko using the link below and login using SteemConnect to claim your 3000 Partiko points! You can easily convert them into Steem token!
https://partiko.app/referral/partiko
Congratulations @magickmynd! You received a personal award!
You can view your badges on your Steem Board and compare to others on the Steem Ranking
Vote for @Steemitboard as a witness to get one more award and increased upvotes!