Candlestick pattern that you shoud know
Few days ago, I posted why to learn candlestick cause learning just a few key candlestick patterns will improve your ability to recognize trading opportunities and be better in trading. Candlestick emerged because human actions and reactions are patterned and constantly replicate and are captured in the formation of the candles by recognizing these patterns and applying the the lessons that the patterns teach, can and does yield results in your trading. as what people say history repeat itself so we must be ready.
so starting today I am gonna post 1 candlestick pattern. The first one is the most known one of best traders. It is the Doji Candlestick.
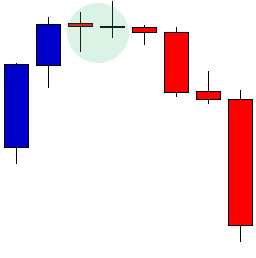
A Doji candle is the name given to patterns which signify indecision in the price action of a stock. Usually these form at areas where the bulls and bears commence battle and are fighting each other for direction.
In a doji candle, the body is usually very small with a close near the open price, and can have long wicks formed to the high and low, which were tested but fought back from by each side. The pattern signifies uncertainty, indecision, and is waiting for either the bulls or bears to take control. Often the next direction is an upwards or downwards sustained move in price as the stock breaks beyond the Doji candle.

Although the Doji candle is often not a great entry candle for a trade (due to its nature it could be broken either way by the bulls or bears), it does offer a heads up that sentiment may be changing.
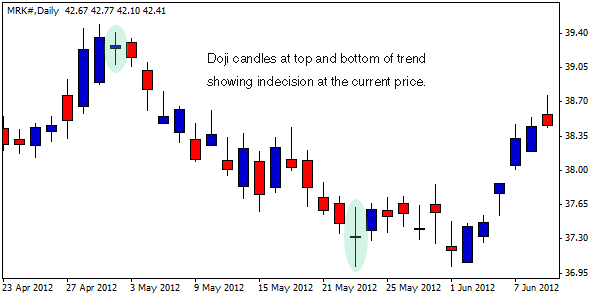
On this example below, Merck (MRK) had found a new high, but the next day a Doji formed. Were the bulls or bears going to win this battle? As we can see, bears won and the first doji highlighted was followed by two very strong down days, starting a new trend.
The second doji highlighted shows how sentiment could be changing. The Doji formed at a low in price and at this point bulls came out of the shadows and saw value. This formed a support area over the next week, and as price made a breakout above the Doji candle, the stock entered a strong uptrend lasting three months.

I hope this will help you.
To learn more about candlestick follow and upvote me.
