Ethereum Price Technical Analysis: Hits a New 1 Month Low

Ethereum price made heavy downside moves against the US Dollar and Bitcoin, and ETH/USD might continue to trade
Key Highlights
ETH price is under heavy selling pressure, and recently broke the $220 and $200 support levels against the US Dollar.
There are two bearish trend lines with resistances as $204 and $225 forming on the hourly chart of ETH/USD (data feed via SimpleFX).
On the downside, an initial support is near $186, followed by the $165 level.
Ethereum Price under Pressure
There was a solid increase in selling pressure in ETH price as it moved below the $220 and $200 support levels against the US Dollar. The price even struggling to hold the $190 level and recently traded as low as $185.13 from where a minor recovery started. The price corrected higher and tested the 38.2% Fib retracement level of the last decline from the $246.64 high to $185.13 low.
Sellers are in control at the moment, and the price may soon resume its decline and trade back towards $185. On the upside, there are two bearish trend lines with resistances as $204 and $225 forming on the hourly chart of ETH/USD. The first trend line is an initial hurdle, but the second one at $225 is more important. It coincides with the 61.8% Fib retracement level of the last decline from the $246.64 high to $185.13 low. As long as the price is struggling to move back above $220, there are chances of more declines. 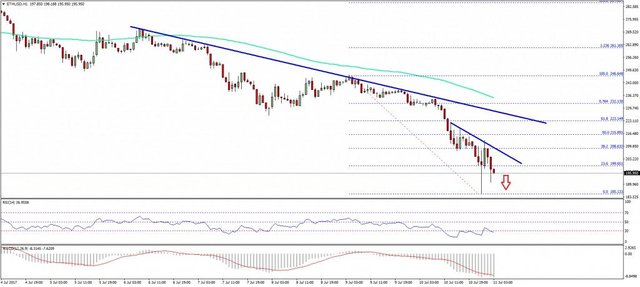
ETH could retest $185 soon and a break below it may take the price towards $170. Selling rallies towards $220 may be considered in the short term for $185-170.
Hourly MACD – The MACD is well placed in the bearish zone.
Hourly RSI – The RSI is moving to and fro around the oversold levels, signaling weakness.
Major Support Level – $185
Major Resistance Level – $220