The Changing Structure of the American economy, its workforce and the middle class from 1971 to 2017 - Characteristics, Trends and Prospects
Authored by www.HedgedEquity.com, the premier destination for market leading model portfolios and proprietary research.
The American economy remains to date the world’s largest both in absolute and relative terms. Its GDP of $18.57 trillion in 2017 puts it comfortably ahead of the closest second, China, with its figure of $11.2 trillion.[1] The USA also constitutes 22% of world GDP, despite having only slightly more than 4% of the world’s population.[2] This apparent position of dominance, however, does not fully reflect the underlying trends that have been changing the American economy and its workforce in the last 4 decades. These trends have deeply impacted the middle and lower sections of the population, the so called working class and the composition of the economy. This paper will outline the growth, changing structure and trajectory of the American economy since 1970 to the present day. The trends changing industrial structure of the US economy will be delineated, with an emphasis on the rise of the financial and technological sectors. Particular attention will also be given to the changes in employment patterns of Americans and other indicators of social life conditions. The issue of changing concentration of wealth within the population, especially related to trends in real estate prices and equity prices, will also be discussed. The overall current condition and potential growth prospects of the US economy today will be mentioned in the final instance.
Year 1971 is considered to be a landmark year in history, as the August of that year marked the end of the Bretton Woods monetary system. This was in essence the fixed-price convertibility of the dollar into gold at $35/ounce, underpinning global economics since its establishment in 1944. The end of the Bretton Woods system and dollar convertibility inaugurated a period of significant economic stagnation and increasing inflation through the 1970s.
Key points (US economy and workforce composition) –
- The number of Americans employed in manufacturing has fallen from approximately 25% of the total workforce in 1970 to less than 10% today[3]. At the same time, employment in services has gone from 70% of the workforce in 1970 to close to 90% currently.
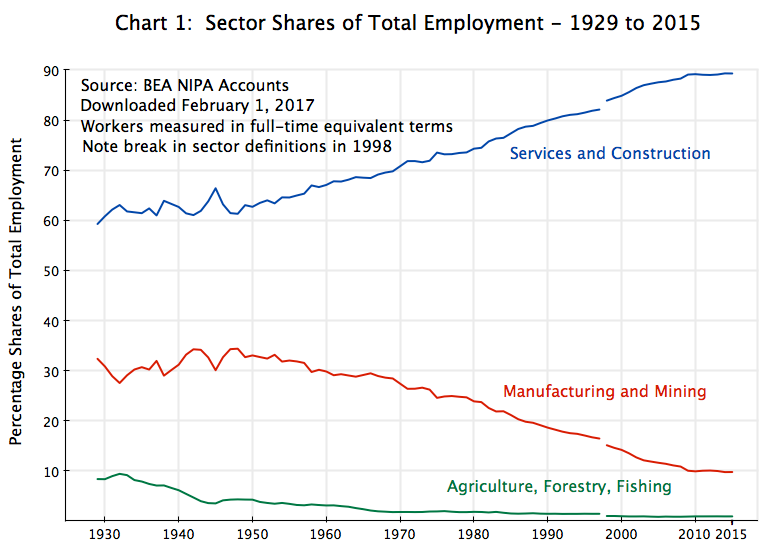
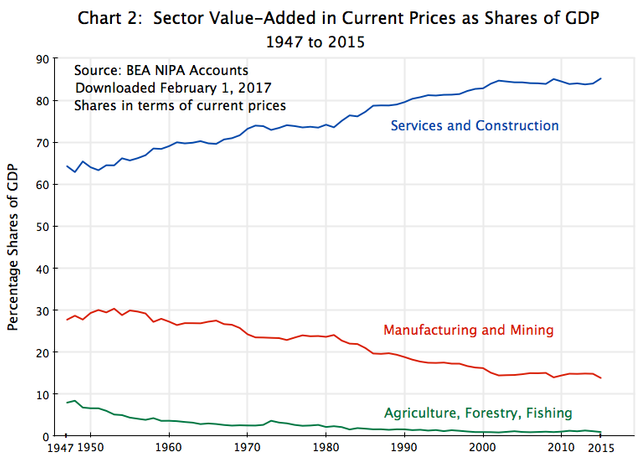
Not only has the American workforce become increasingly employed by the tertiary sector, but the sector has also come to dominate the amount of value added to GDP, above 85% of the total
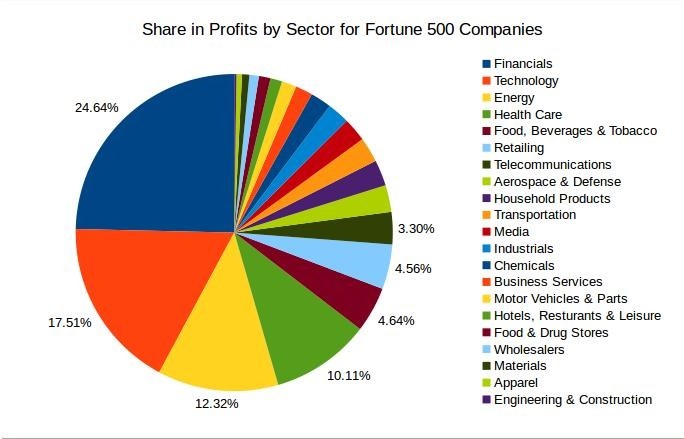
Approximately 42% of the profits generated by the Fortune 500, the largest 500 companies in the USA, in 2015 came from technology and financial companies.
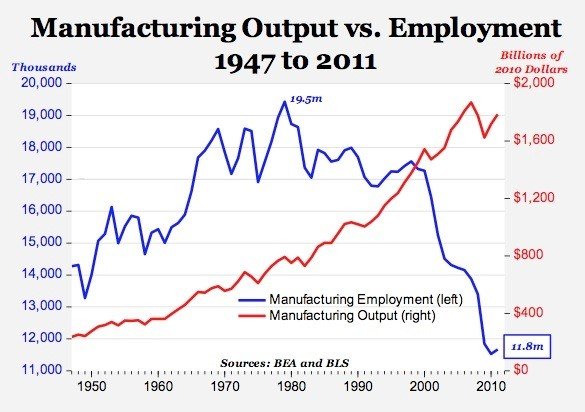
While proportion of the workforce employed in manufacturing has declined, manufacturing output has continued to rise. This has occurred thanks to significant advances in productivity.
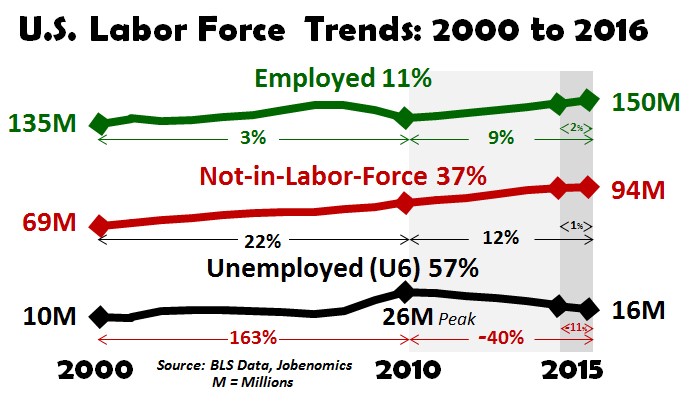
Overall labor force participation rate has trended upwards from 1970 until the late 1990s, when it peaked out the 67% level. It has now retrenched to below 63%, where it last was in 1979. During this downtrend the unemployment rate has fluctuated between 3.7% and 10.8% since 1971, in July 2017 registering in at 4.3% or a 16-year low.This is the consequence of more and more citizens not pursing jobs actively. In 2000 there were 69 million citizens not in the labor force, a figure which by 2015 had ballooned to 94 million, or 25 million more.

Part of this shift can be attributed to demographics. The “baby boomer” cohort, namely those born between 1946 and 1964 comprises an estimate 79 million citizens.[4] The first retirees of this cohort came in 2006, and an estimated 10,000 baby boomers will exit the workforce every single day until 2029, or more than 3.6 million per year.[5][6] By 2020, about 25% of the US workforce will composed of workers aged 55 and above, which is likely to reduce the labor participation rate further.
The Rise of the Debt economy: Yes, we’ve all heard and read about it before. However, below are some intriguing points though that we may not have known:
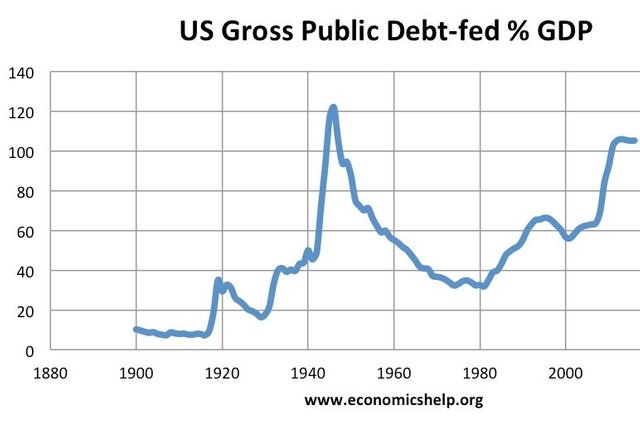
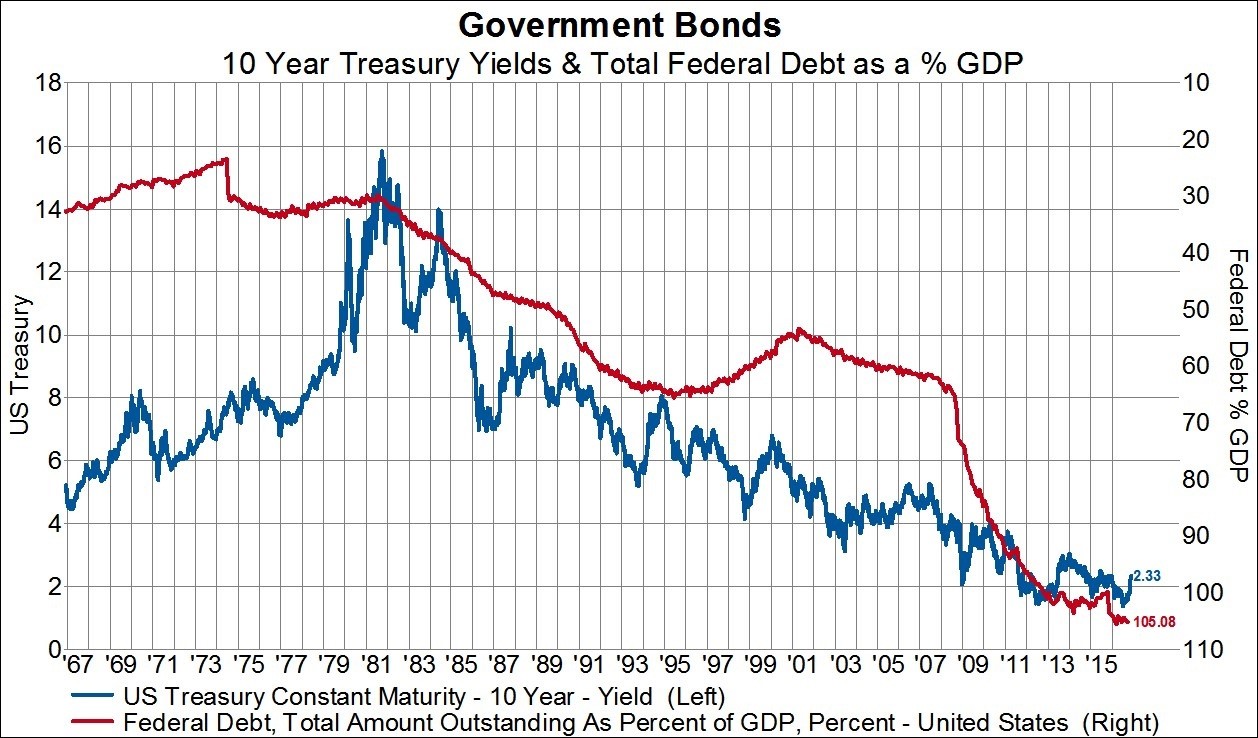
Federal debt as a percentage of GDP has risen from 25% in 1980 to the current figure of 106%.
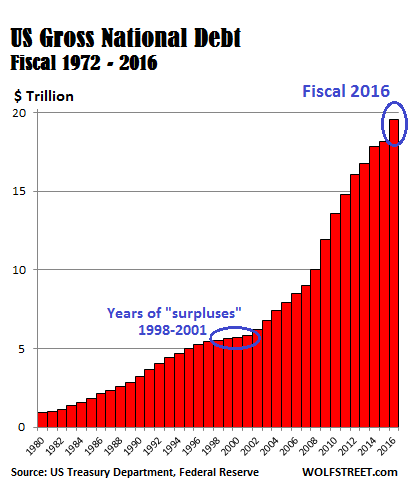
After first surpassing the $1 trillion mark in October 1981, it reached $10 trillion in 2008 and has now touched $20 trillion before the end of 2017.
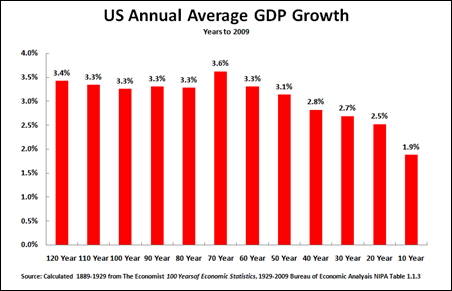
While government debt has increased, GDP growth has been on a downward trend with the maturing of the US economy.
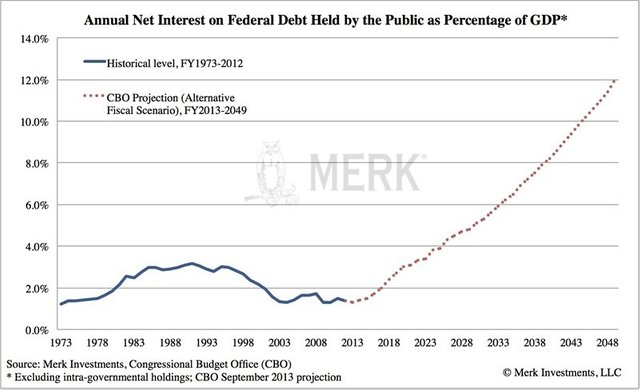
The debt interest burden, as a percentage of the US budget, has however remained tame. This is a consequence of US interest rates resting close to at all-time lows. This is however most likely about to change (relatively soon)
Projections by the Congressional Budget Office show that Federal debt accumulation will continue - adding another $10 trillion by 2027 and becoming equivalent to 150% of GDP by 2030.
Now, here comes the interesting part.....
The American Consumer - Debt & Inequality – the untold story
The US consumer remained largely debt-free until 1970. It was a combination of falling interest rates, which peaked with a prime rate of over 16% in 1981, in combination with better economic growth, that set off a multi-decade trend in increasing personal debt. As the Reagan administration cut taxes and boosted spending, GDP growth revived. With oil prices receding and inflation subsiding, the Federal Reserve cut interest rates. Since then, the speed of the rise in credit card debt has outstripped that of American households incomes.
Credit card debt per capita rose by 1,200% in the 1980-2010 period, eclipsing the 300% growth of household income. Total personal debt, measured in 2010 dollars, increased from $1,186 per capita in 1948 to $10,168 in 2010. The “Great Recession” of 2008-2009 has marked an inflection point in the long uptrend of consumer debt. Households have begun to moderately deleverage, paying down credit card balances. Starting from 2011, however, there was a renewed pick up as the economy recovered. Total credit card debt has now surpassed the $1 trillion level in April 2017 for the first time in more than decade.
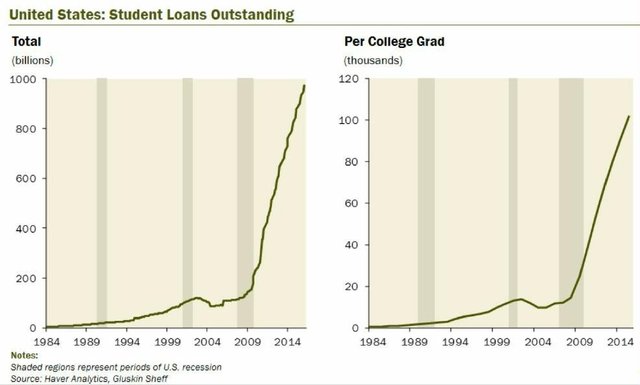
Other forms of debt, above all student loans, have continued their upward trajectory. Student debt has risen from 0 in 1980 to close to $1.3 trillion by early 2017.[7][8] It rose 500% only between 1999 and 2011.[9] This has resulted mainly from a rise in college tuition fees that have outstripped inflation and income gains. Today student loans are equivalent to 8% of US GDP, an all-time high.
In addition, significant divergences in incomes within the American population have emerged. These have been the consequence of a combination of factors:
• Outsourcing of jobs abroad, and advances in technology & software.
• A significant increase in asset values, mainly equities and real estate, which has accrued to a minority of the population[10]
• An growing divergence in high-skill job and low-skill job salaries[11]
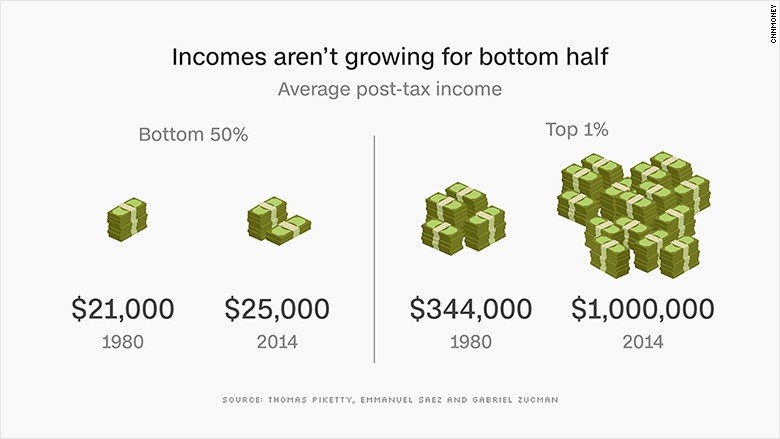
The top 1% of the US population earned on average $1 million a year after-tax in 2014, compared to $344,000 in 1980, and increase of 190.7%. The bottom 50%, however, earned $25,000 after-tax in 2014 compared to $21,000 in 1980, an increase of less than 25%.
Growing income inequality -
The divergence in wealth is even more pronounced. The top 0.1% of American families owned close to 23% of the country’s private wealth in 2013, up from less than 8% at the end of the 1970s and close to levels last seen in the 1930s. The top 1% owns approximately 40% of the total wealth, compared to only 7% for the bottom 80% of Americans.[12] Data from the Economic Policy Institute shows, the bottom 60% has seen reductions in their wealth over the last 30 years, while the top 5% has seen significant gains. It is estimated that 95% of financial assets are owned by the top 10% of American families, who also own 78% of real estate assets.
Conclusion - Future Trends & Prospects - putting it all in perspective......
The wealth divergence in the US has become extreme by both historical and global measures. This is in part due to the unequal distribution of financial assets, which has made the positive performance of the latter in the past 3 decades beneficial to a minority of the American population. The longer-term effects are (possibly) the suppression of demand, which ties down economic growth (consumption still accounts for approximately 70% of American GDP)[13]. Attempts to kickstart consumption growth have been held back by the already high amount of debt borne by American households. With little addition growth in debt propelling consumption, GDP growth will most likely continue to remain weak.
The current level of indebtedness, at the government, private sector and consumer level, is being absorbed (relatively) by the economy because of a low interest rate environment. This is in part the consequence of weak American growth, a deliberate policy of the Federal Reserve to contain rate increases, and the status of the US dollar as the world’s reserve currency. Various observers have commented how these levels of indebtedness, if experienced by developing countries, would in most cases would have already led to a debt and currency crisis.[14] The situation could thus continue indefinitely, as long as confidence in the solvency of the US government remains unchanged.
Technological progress has made a significant impact on the structure of the economy and the composition of the labour force. As more and more low-skilled jobs are made obsolete by automation, outsourcing and software, downwards wage pressure will persist for the less-educated segments of the population. Nevertheless, this may also increasingly happen to higher-paying, middle-class jobs (it is already happening!!). There is already evidence of software programming advances that may automate large swaths of the accounting, legal and finance professions. Consulting firm PriceWaterhouseCoopers estimates that up to 38% of jobs in the US may be computerised by 2030, while a study from Oxford University puts this figure at 47%.[15][16] The societal impacts would be significant, possibly resulting in mass unemployment and an sharpening of wealth divergence within the population. At the same time, this will create significant economic growth in sectors such as automation, Artifical Intelligence and software engineering. With an ageing population population, growth in the American biotech, healthcare and pharmaceutical sectors can also be expected to remain robust. Other sectors perhaps not so much.
[1] http://databank.worldbank.org/data/download/GDP.pdf
[3] http://www.mybudget360.com/millennials-employed-military-food-services-and-retail-jobs-income-wages/
[4] https://www.bls.gov/opub/mlr/2002/05/art2full.pdf
[6] https://www.business.com/articles/baby-boomer-retirement-avoid-a-senior-moment-in-your-business/
[8] http://davidstockmanscontracorner.com/1-2-trillion-in-us-student-loans-a-ticking-time-bomb/
[10] http://www.motherjones.com/politics/2011/02/income-inequality-in-america-chart-graph/
[11] http://money.cnn.com/2016/12/22/news/economy/us-inequality-worse/index.html
[12] http://www.businessinsider.com/inequality-in-the-us-is-much-more-extreme-than-you-think-2015-6
[13] https://www.thebalance.com/components-of-gdp-explanation-formula-and-chart-3306015
[14] https://www.newyorker.com/news/john-cassidy/the-reinhart-and-rogoff-controversy-a-summing-up
[15] http://www.pwc.co.uk/economic-services/ukeo/pwcukeo-section-4-automation-march-2017-v2.pdf
[16] http://www.oxfordmartin.ox.ac.uk/downloads/academic/The_Future_of_Employment.pdf
Hello!