BTS (BITSHARES): Needs to Find the Bottom in Pattern & Elliott Wave Count
SUMMARY
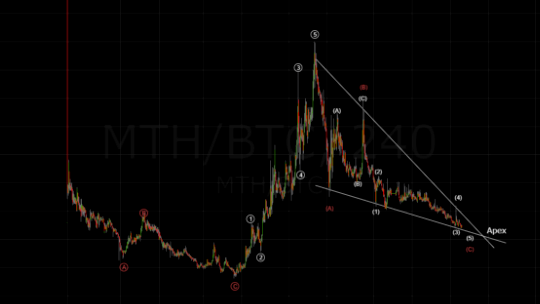
Even into this upward wedge; the seller repletion just was not enough to fulfill the wedge price travel guidance. The Hurry Up & Wait syndrome has been in full effect. This is when the impulse moves near vertical and the correction phase slows to a crawl. When drawing chart patterns, I do take liberty in cutting out or ignoring some price wicks as you can see, the tallest wick is not considered for the pattern or Elliott Wave counting.
A redraw of the correction into a bullish downward symmetrical triangle is quite impressive because of near termination status. It's almost done.

A full label of waves, subwaves and pattern is showing a culmination of technical events that is signaling an impending trend reversal. The September correction showed an upward pointing wedge as shown in below chart.
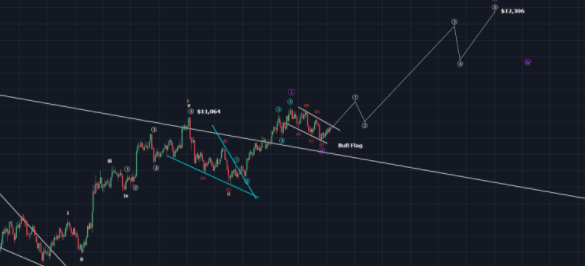
The future price pathway projection shows primary to be the blue Elliott Waves with a target of 2,254 Satoshi.

Legal Disclaimer: This post is for general information only. No information, forward looking statements, or estimations presented herein represent any final determination on investment performance. While the information presented in this post has been researched and is thought to be reasonable and accurate, I cannot and do not guarantee any rate of return or investment timeline based on the information presented herein.

