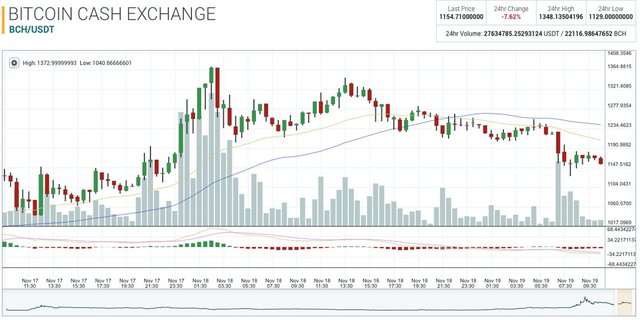
Bitcoin Cash (BCH) Technical Indicators
Looking at BCH charts also shows theres been some pretty consistent 36-hour market stability, but there’s heavy resistance in the $1300 region. The short-term 100 SMA is a touch higher from the long-term 200 SMA indicating a good chance for more upside swings. Expect some resistance in the $1300 area again and even more so around $1400 territory. Both the RSI and the stochastic reveal there’s definitely room for upper bounds in BCH value. The price could surpass $1300-1400 again in the near future, but it also could slide back to $1100-1000. 
The Verdict
As far as markets go, many traders have moved their attention away from the scaling debate and forks, and seem to be focused on better long-term positions. Traders are optimistic in regard to bitcoin exceeding the $8K territory, as many believe we will see $10K by the year-end. Speculators think the upcoming futures contracts from CME Group will bolster the price, alongside Cboe entering the game as well. So far LedgerX has already been processing millions of dollars worth of futures products, and at least one trader has wagered a long position predicting that bitcoin will hit $10K by December 28.Where do you see the price of bitcoin (BTC) going from here? What do you think about bitcoin cash (BCH) markets right now? Let us know your thoughts in the comments below.Disclaimer: Bitcoin price articles and markets updates are intended for informational purposes only and should not to be considered as trading advice. Neither Bitcoin.com nor the author is responsible for any losses or gains, as the ultimate decision to conduct a trade is made by the reader. Always remember that only those in possession of the private keys are in control of the “money.”