Bitcoin Gold Price Technical Analysis – BTG/USD Struggle Continues
Bitcoin gold price is in a bearish trend below $320 against the US Dollar. BTG/USD is holding $250, but remains at a risk of more declines.

Key Points
Bitcoin gold price declined recently and moved below the $300.00 support against the US Dollar.
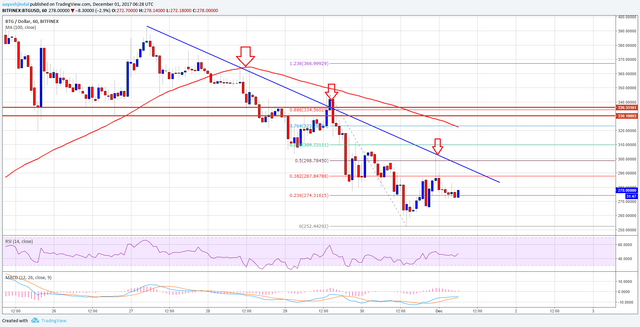
This is a major bearish trend line forming with resistance at $290 on the hourly chart of BTG/USD (data feed from Bitfinex).
The price might continue to struggle to break the $290 and $300 resistance levels in the near term.
Bitcoin gold price is in a bearish trend below $320 against the US Dollar. BTG/USD is holding $250, but remains at a risk of more declines.
Bitcoin Gold Price Barrier
There was no respite for bitcoin gold price as it remained below the $350 pivot against the US Dollar. The price made a downside move and traded below the $320 and $300 support levels. The decline was strong and the price even tested the $250 support area. A low was formed at $252.44 from where a correction was initiated. It moved above the 23.6% Fib retracement level of the last decline from the $346 high to $252 low.
However, the upside move was limited by the $300 resistance. Buyers failed to push the price above $300 and $310 resistance levels. The 50% Fib retracement level of the last decline from the $346 high to $252 low also acted as a major hurdle. Moreover, a major bearish trend line with current resistance at $290 on the hourly chart of BTG/USD also prevented upsides. It seems like the pair is facing a lot of hurdles on the upside near $300 and $320.
As long as the price is below $300 and $320, it might continue to move down. On the downside, the $250 support is very important followed by the $220 level.
Looking at the technical indicators:
Hourly MACD – The MACD for BTG/USD is about to move back in the bearish zone.
Hourly RSI (Relative Strength Index) – The RSI for BTG/USD is still below the 50 level.
Major Support Level – $250
Major Resistance Level – $300