Cryptocurrency and ICO Market Analysis (June 18–24, 2018)


This report presents data on cryptocurrency and ICO market changes during 2018. Special emphasis has been placed on an analysis of the changes that have taken place in June 2018, including over the past week (June 18-24, 2018).
Information as of June 25, 2018
Professor Dmitrii Kornilov, Doctor of Economics, Member of the Russian Academy of Natural Sciences, and Leading Analyst at ICOBox
Dima Zaitsev, PhD in Economics, Head of International Public Relations and Business Analytics Department Chief at ICOBox
Nick Evdokimov , Co-Founder of ICOBox
Mike Raitsyn , Co-Founder of ICOBox
Anar Babaev , Co-Founder of ICOBox
Daria Generalova, Co-Founder of ICOBox
Cryptocurrency Market Analysis (June 18-24, 2018)
1. General cryptocurrency and digital assets market analysis (by week, month, quarter). Market trends
1.1. General cryptocurrency and digital assets market analysis (by week, month)
1. General cryptocurrency and digital assets market analysis (by week, month, quarter). Market trends
1.1. General cryptocurrency and digital assets market analysis (by week, month)
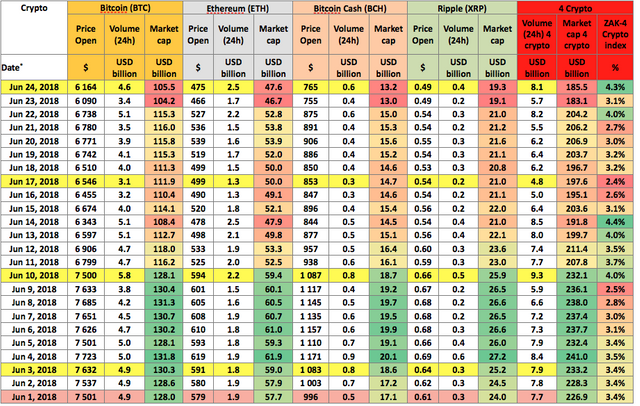
Table 1.1. Trends in capitalization of the cryptocurrency market and main cryptocurrencies from April 1, 2018, to June 24, 2018
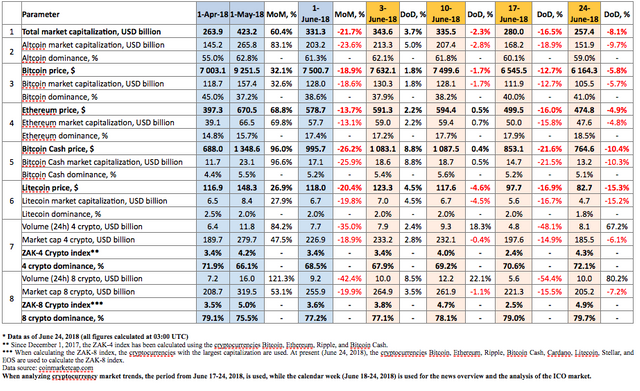
Over the analyzed period (June 17-24, 2018) cryptocurrency market capitalization decreased by $22.6 billion, from $280 billion, and as of 03:00 UTC on June 24 equaled $257.4 billion (see Table 1.1). Overall, the fall since the start of the month has equaled around $70 billion.
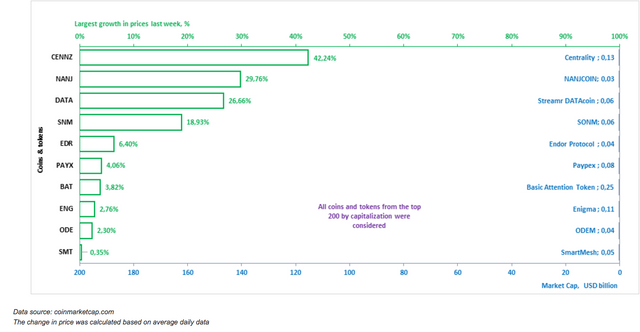
The dominance of the four and eight largest cryptocurrencies as of 03:00 UTC on June 24, 2018, equaled 72.1% and 79.7%, respectively, with bitcoin dominance increasing to 41% (see Table 1.1). Despite the overall reduction in cryptocurrency market capitalization, considerable growth was seen last week in the prices of certain cryptocurrencies from the third echelon by capitalization (top 500), such as LatiumX (+70%), Envion (+52.64%), Centrality (+42.24%), NANJCOIN (+29.76%), Streamr DATAcoin (+26.66%) and others.
During the period (June 17-24, 2018) cryptocurrency market capitalization fluctuated from $294 billion (max) to $235 billion (min) (Fig. 1a), i.e. within a range of $59 billion. For its part, bitcoin capitalization fluctuated from $116.6 billion (max) to $99.7 billion (min), i.e. within a range of $15.9 billion.
As noted before, there has been a very high correlation between the capitalization of the cryptocurrency market as a whole (Fig. 1a) and bitcoin for more than a month, and the past week was not exception (see Fig. 1b). The maximum and minimum points and the overall configuration of the cryptocurrency market capitalization charts show an almost complete correspondence.
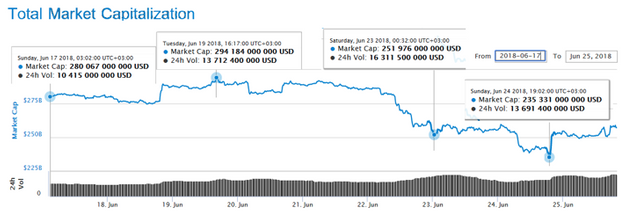
Figure 1a. Cryptocurrency market capitalization since June 17, 2018
Figure 1b shows bitcoin capitalization (red line) superimposed on cryptocurrency market capitalization (blue line). The lines are practically identical.
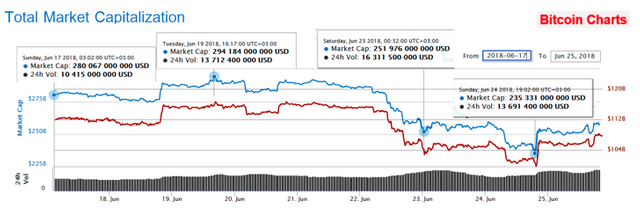
Figure 1b. Capitalization of the cryptocurrency market (blue) and bitcoin (red) since June 17, 2018
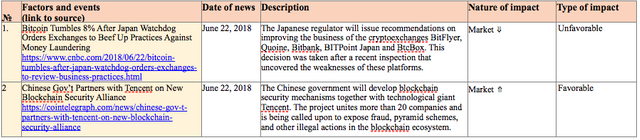
The main drops in market capitalization took place on June 20, 22, and 24 (see Fig. 1b). The fall in capitalization on June 20 can be partially explained by the news on a hacker attack on the Bithumb cryptoexchange. On June 22 the Japanese Financial Services Authority (JFSA) required the cryptocurrency companies bitFlyer, QUOINE, BTC Box, Bit Bank, Tech Bureau, and Bit Point to improve their AML/KYC procedures and imposed administrative penalties (sanctions) on these companies. The JFSA previously planned to introduce tough registration standards for bitcoin exchanges. The 24-hour trading volume of Tether increased. In fact, from June 23, 2018, it equaled nearly $3.8 billion, i.e. more than Ethereum ($1.7-2.2 billion) and almost as much as Bitcoin (see Table 1.5.a).
The rise and fall of cryptocurrency prices over the past seven days (June 17-24, 2018)
During the period from June 17-24, 2018, the change in the prices of cryptocurrencies in the top 500 ranged from -58.29% (All Sports) to +70% (LatiumX). In particular, LatiumX experienced solid price growth this week thanks primarily to the announcement of the launch of its revolutionary new platform (https://twitter.com/bitcoinist/status/1009376788055756800). At the same time, All Sports continued its negative trend (downward adjustment) after its impressive growth in May.
The price of only 33 cryptocurrencies and digital assets from the top 500 showed growth, including only three from the top 100.
Over the past week the number of cryptocurrencies with a capitalization of more than $1 billion remained the same at 18, with the price of all of them falling except Tether (the price of which is tied to the US dollar). A downward adjustment was seen for EOS (-28.32%), NEM (-22.05%), Cardano (-20.64%), etc.
The coins and tokens from the top 200 that demonstrated the largest price growth are given in Fig. 2.
Biggest gainers and losers over the week (June 17-24, 2018)
The prices of some cryptocurrencies may fluctuate from -50% to +50% over the course of a single day. Therefore, when analyzing cryptocurrency price trends, it is advisable to use their average daily amounts on various cryptoexchanges.
Below we consider the 10 cryptocurrencies that demonstrated the most significant change in price over the past week (Fig. 2-3). In this regard, only those coins and tokens included in the top 200 (Fig. 2) and top 100 (Fig. 3) in terms of market capitalization (according to the data of coinmarketcap.com) were considered2.
Figure 2. Largest growth in prices over the past week
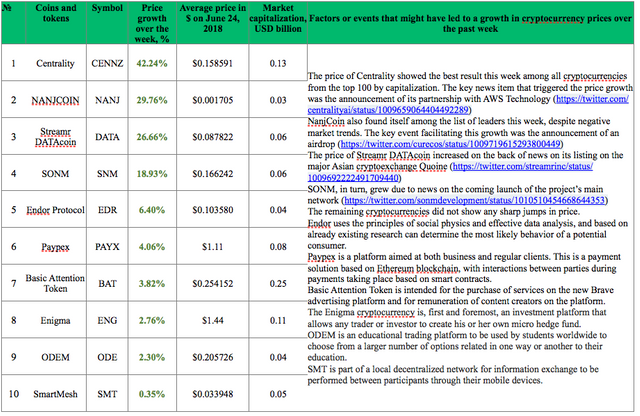
Tables 1.2 and 1.3 show the possible factors or events that might have influenced the fluctuation in prices for certain cryptocurrencies. Table 1.4 shows the possible factors or events that might have influenced the cryptocurrency market in general.
Table 1.2. Factors or events that might have led to a growth in cryptocurrency prices over the past week
A depreciation in price was seen last week for 467 coins and tokens from the top 500 cryptocurrencies and digital assets by capitalization. The ten cryptocurrencies from the top 100 that experienced the most noticeable drops in price are shown in Fig. 3 and Table 1.3.
Figure 3. Largest fall in prices over the past week
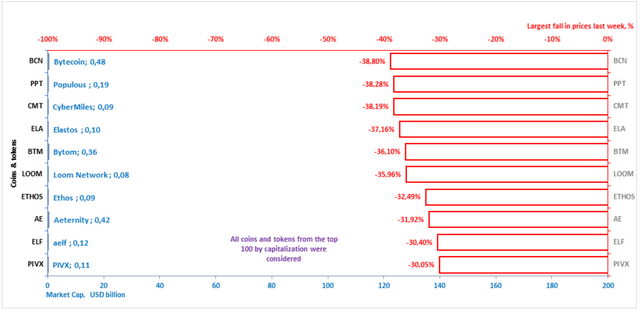
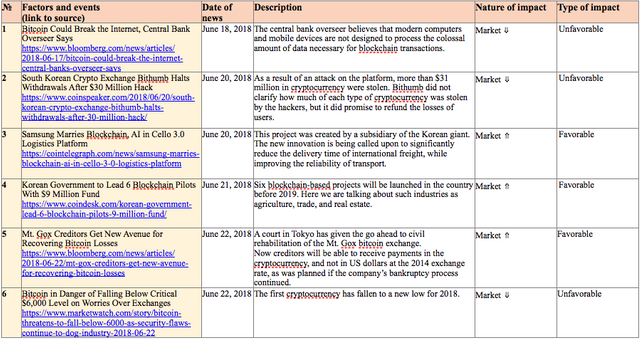
Table 1.3. Factors or events that might have led to a fall in cryptocurrency prices over the past week
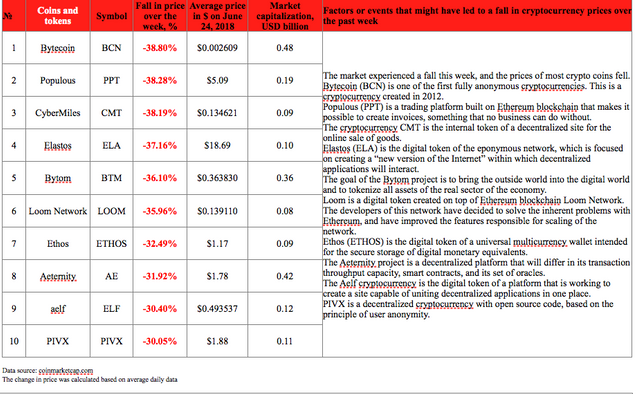
Table 1.4 shows events that took place from June 18-24, 2018, that had an impact on both the prices of the dominant cryptocurrencies and the market in general, with an indication of their nature and type of impact.
Table 1.4. Key events of the week having an influence on cryptocurrency prices, June 18-24, 2018
To analyze trading activity on cryptocurrency exchanges, the ZAK-n Crypto index is calculated (see the Glossary). The values of the ZAK-4 Crypto and ZAK-8 Crypto indices are presented in Tables 1.1, 1.5.a, and 1.5.b. In June the 24-hour trading volumes (Volume 24h) for the four dominant cryptocurrencies (Bitcoin, Ethereum, Bitcoin Cash, Ripple) equaled from $4.8 billion to $9.3 billion (Table 1.5.a). The value of the daily ZAK-4 Crypto ranged from 2.4% to 4.4% of capitalization. The highest trading volume was seen on June 14.
Table 1.5.a. Daily ZAK-4 Crypto index calculation (from June 1-24, 2018)
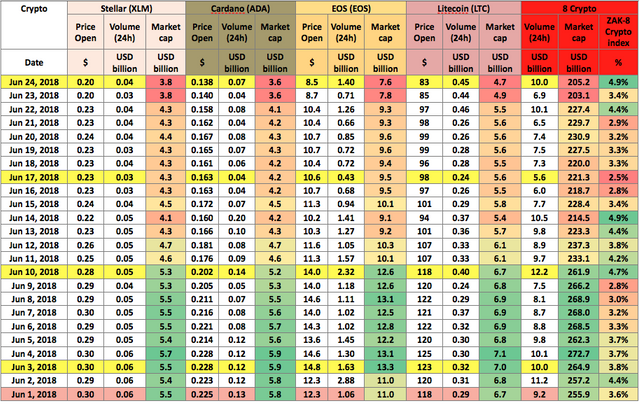
The 24-hour trading volumes (Volume 24h) for the eight dominant cryptocurrencies (Bitcoin, Ethereum, Bitcoin Cash, Ripple, Litecoin, Stellar, EOS, and Cardano) increased to $10 billion by the end of last week (Table 1.5.b), or 4.9% of their market capitalization. The ZAK-4 Crypto and ZAK-8 Crypto indices are considered in more detail in Tables 1.5.a and 1.5.b.
Table 1.5.b. Daily ZAK-8 Crypto index calculation (continuation of Table 1.5.а)
Since May 22, Huobi, one of the largest cryptoexchanges, began issuing the new consolidated HUOBI 10 index, which shows the trends of 10 digital assets with a high market value and liquidity. Last week the Huobi index was added to Bloomberg Terminal. The index equaled around 780 points (June 25, 2018, 10:00 UTC/GMT+3). At its lowest point the index equaled 712 points (June 23, 2018). We remind you that the base point of the HUOBI 10 is 1000.
Table 1.6 gives a list of events, information on which appeared last week, which could impact both the prices of specific cryptocurrencies and the market in general.
Table 1.6. Events that could have an influence on cryptocurrency prices in the future
1.2. Market trends
The weekly cryptocurrency and digital asset market trends from December 31, 2017, to June 24, 2018, are presented as graphs (Fig. 1.1-1.5).
Table 1.7. Legends and descriptions of the graphs
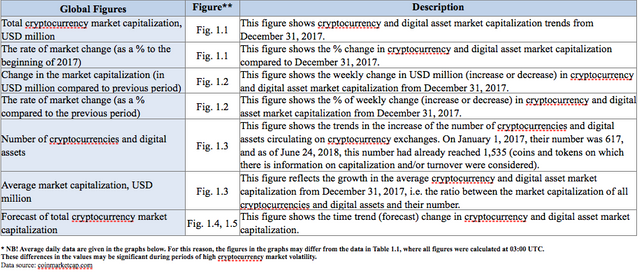
Figure 1.1. Total cryptocurrency market capitalization
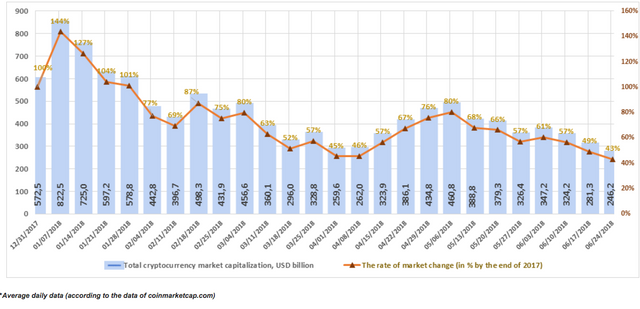
Figure 1.1 shows a graph of the weekly cryptocurrency market change from December 31, 2017, to June 24, 2018. Over this period, market capitalization dropped from $572.5 billion to $246.2 billion, i.e. by 57%. Last week (June 17-24, 2018) cryptocurrency market capitalization decreased from $281.3 billion to $246.2 billion (as of June 24, 2018, based on the average daily figures from coinmarketcap.com).
Figure 1.2. Change in market capitalization
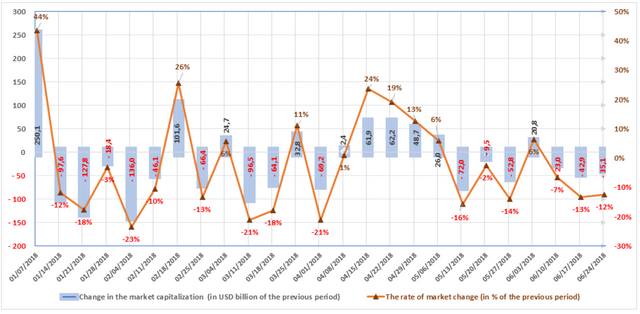
The market is susceptible to sudden and drastic fluctuations. During the first week of January, market capitalization increased by approximately $250 billion, or 44%. The largest weekly fall in the first quarter of 2018 equaled $136 billion, or 23%, during the period from January 28-February 4, 2018.
Nine of the thirteen weeks in the first quarter of 2018 were “in the red”, i.e. capitalization fell based on the results of each of these weeks. In the second quarter, the market grew over the first five weeks, followed by periods of downward adjustment. Over the past week (June 17-24, 2018) the market contracted by around 12%, or $35.1 billion (with due account of average daily data, see Fig. 1.2).
Figure 1.3. Number of cryptocurrencies and digital assets
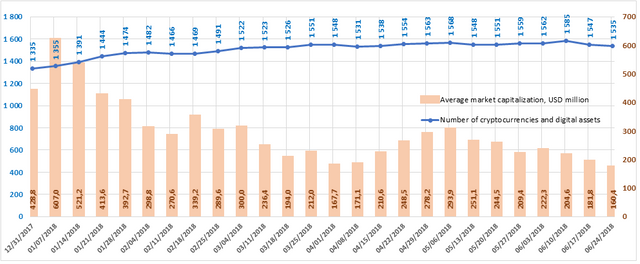

Since December 31, 2017, the total number of cryptocurrencies and digital assets considered when calculating market capitalization has increased from 1,335 to 1,535. Over the past week their number decreased by 12, from 1,547 to 1,535, and average capitalization fell to $160.4 million. In total, over the past month 47 new coins and tokens have appeared on coinmarketcap.com. However, it should be noted that a number of other coins and tokens were also excluded from the list. From among the tokens that were added to coinmarketcap.com last week, Merculet and Sentinel Protocol showed high trading volumes.
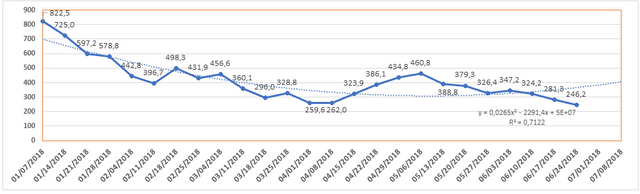
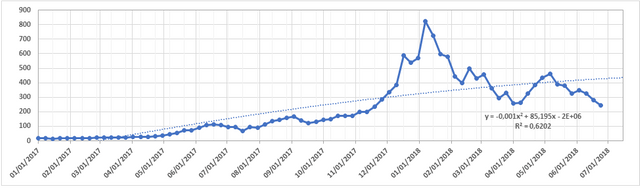
Figures 1.4 and 1.5. Forecast of total cryptocurrency market capitalization
Last week (on June 20, 2018) another hacker attack on a cryptoexchange was reported, this time on Bithumb - the sixth largest exchange by trading volume according to coinmarketcap. Around $31 million were stolen from the exchange. You will recall that on June 10 the losses of the South Korean cryptoexchange Coinrail due to a hacker attack equaled around $40 billion won (around $37 million). Placing funds on cryptoexchanges is a risky business. Another “cryptocurrency” project, Turcoin, a pyramid scheme organized by the Istanbul-based company Hipper, is a perfect confirmation of this fact. According to the data of AMBcrypto, the stolen funds of project participants may equal around $1 billion Turkish liras, or $212 million.
Pursuant to an announcement of СoinDesk, a group of Chinese hackers gained $800,000 through illegal mining of the siacoin cryptocurrency. According to a local news item on June 16, 2018, police in the city of Rui'an (Zhejiang Province) arrested 16 suspects, who are charged with hacking more than 100,000 computers in internet cafes in 30 Chinese cities in July 2017.
As recently as our previous report we named cybersecurity as one of the key problems currently facing the crypto market. According to the expert estimates of the cybersecurity company Carbon Black, digital currency worth around $1.1 billion has been stolen in the first half of 2018.
Naturally, all of these events do not facilitate the growth in capitalization of the cryptocurrency market.
However, despite the many tasks and problems facing it, the cryptocurrency market clearly continues to move forward in developing its tools and legal support:
The well-known exchange operator Nasdaq, ABN AMRO Clearing, EuroCCP, and the European settlement and clearing system Euroclear announced in a press release the creation of a blockchain platform for trading in securities and derivatives.
As Bloomberg writes (June 20, 2018), Goldman Sachs Group Inc., one of the largest American investment banks, is considering transactions with cryptocurrencies beyond futures. In the words of David Solomon, the chief operating officer of Goldman Sachs, the company plans to expand the bitcoin futures trading platform, including plans to use other types of derivatives (creating its own flexible version of a future – a “settlement forward”).
Cointelegraph reports that the Japanese Virtual Currency Exchange Association (JVCEA) will issue new optional rules next week.
The well-known cryptoexchange BTCC is resuming its work. On June 19 CoinMarketCap recorded trading (BTCC) in the amount of $58 million.
Jeremy Allaire has announced that each fiat currency will inevitably have a cryptocurrency equivalent ("Our view is that all fiat currency will be crypto"). If the opinion of the head of Circle, expressed in an interview with CNBC, is even somewhat on the mark, cryptocurrency market volumes will increase hundreds of times.
In conclusion, the latest new rating was issued by the researchers of the China Center for Information Industry Development (CCID). As Bitcoinist writes, the three leaders (by CCID version) are: EOS, ETHEREUM and NEO.
ICO Market Analysis (June 18-24, 2018)
1. General analysis of the ICO market (by week, month)
1.1. Brief overview of ICO market trends
1. General analysis of the ICO market (by week, month)
1.1. Brief overview of ICO market trends
Table 1.1. Brief ICO market overview, key events, news for the week of June 18-24, 2018
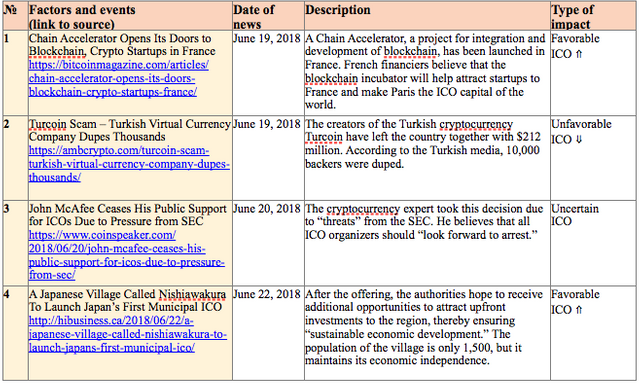
Table 1.2 shows the development trends on the ICO market since the start of the second quarter of 2018. Only popular and/or successfully completed ICOs (i.e. ICOs which managed to collect the minimum declared amount of funds) and/or ICOs listed on exchanges were considered.
Table 1.2. Aggregated trends and performance indicators of past (completed) ICOs1,2,3
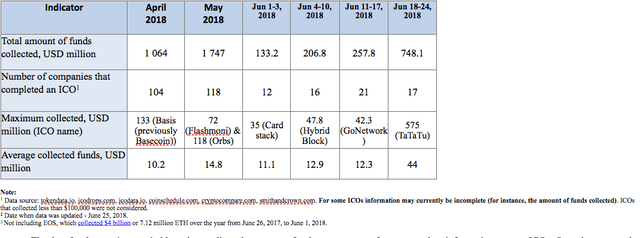
The data for the previous period have been adjusted to account for the appearance of more complete information on past ICOs. Over the past week including Monday (June 18-25, 2018) the amount of funds collected via ICOs equaled $748.1 million. This amount consists of the results of 17 successfully completed ICOs, with the largest amount of funds collected equaling $575 million (TaTaTu ICO). The average collected funds per ICO project equaled $44 million (see Tables 1.2, 1.3). In total, more than 50 ICOs were completed last week.
Table 1.3. Amount of funds collected and number of ICOs
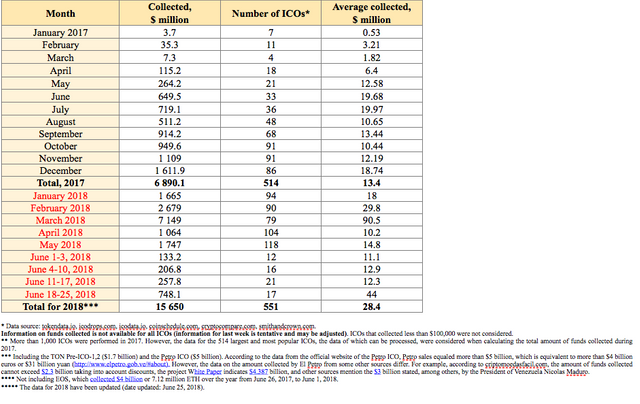
Table 1.3 shows that the largest amount of funds was collected via ICOs in March 2018, mainly due to the appearance of major ICOs. The highest average collected funds per ICO was also seen in March 2018.
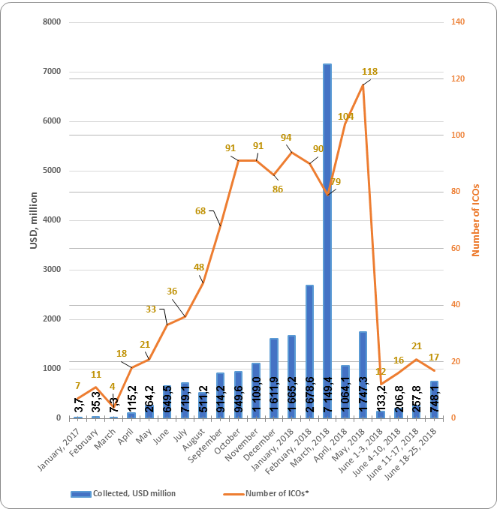
Figure 1.1. Trends in funds collected and number of ICOs since the start of 2017
1.2. Top ICOs of last week
Table 1.4 shows the ten largest ICOs of the week (including Monday, June 25, 2018).
Table 1.4. Top 10 ICOs in terms of the amount of funds collected (June 18-25, 2018)
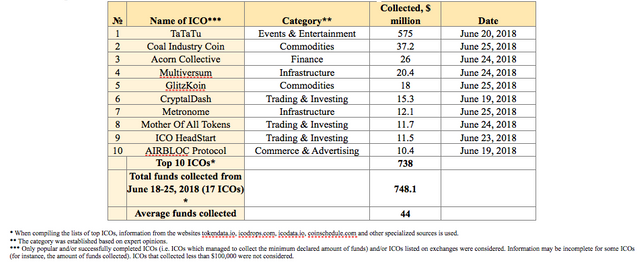
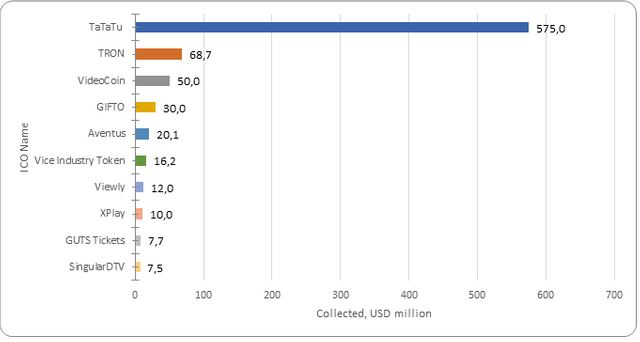
The data for the previous period (June 18-25, 2018) may be adjusted as information on the amounts of collected funds by completed ICOs is finalized.
The leader of the week was the TaTaTu project. This ICO collected a surprisingly large amount of funds, and amounts to a video entertainment platform that will provide tokenized prizes for watching targeted marketing content.
Figure 1.2 presents the ten largest ICOs completed during the past week.
Figure 1.2. Top 10 ICOs by the amount of funds collected (June 18-25, 2018)
1.3. Top ICOs in the Events & Entertainment category
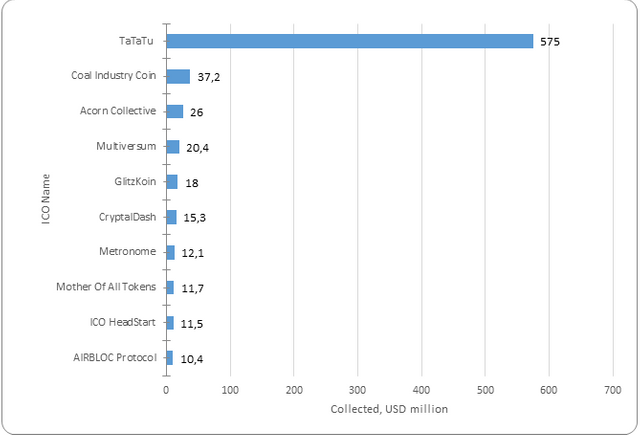
The list of top ICOs by category is compiled with due account of the categories of the leading ICOs for the week. The TaTaTu project became the largest project in the Events & Entertainment category by the amount of funds collected via ICO (Table 1.5).
Table 1.5. Top 10 ICOs by the amount of funds collected, Events & Entertainment category
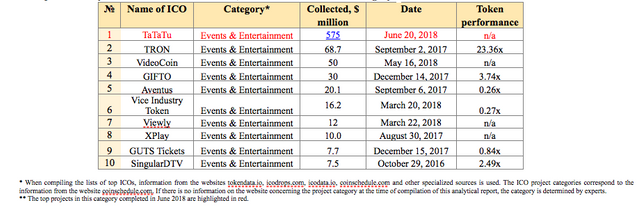
The leader of this category was the TaTaTu project, which plans to release films on blockchain. The project has a “star-studded” group of backers and sets itself ambitious goals. The developers plan to make the process of distribution of income between content producers and content viewers transparent. The more content a person or organization brings to the platform, the higher their income. TaTaTu is a project that takes the interests of users, advertisers, and content providers into account.
The project platform unites content from films, music, games, sport, and video clips. The unique nature of the idea lies in the fact that they will pay users for listening, watching, and playing on the platform.
At present, all projects from the top 10 in this category have a token performance indicator of 0.26x to 23.36x. One of the most successful exchange listing among those presented is the TRON project, as it has a current token price to token sale price ratio of 23.36x. When considering this indicator, it is important to remember that the TRON ICO was completed on September 2, 2017, i.e. the 23.36x growth took place over less than ten months. TRON’s current market capitalization exceeds $2.75 billion.
Figure 1.3. Top 10 ICOs by the amount of funds collected, Events & Entertainment category
During the analyzed period (June 18-25, 2018) at least 17 ICO projects were successfully completed, each of which collected more than $100,000, with the total amount of funds collected equaling more than $750 million. Last week’s leader was the TaTaTu project, which collected $575 million. The total amount of funds collected by a number of ICOs failed to reach even $100,000 (the information for some projects is still being finalized).
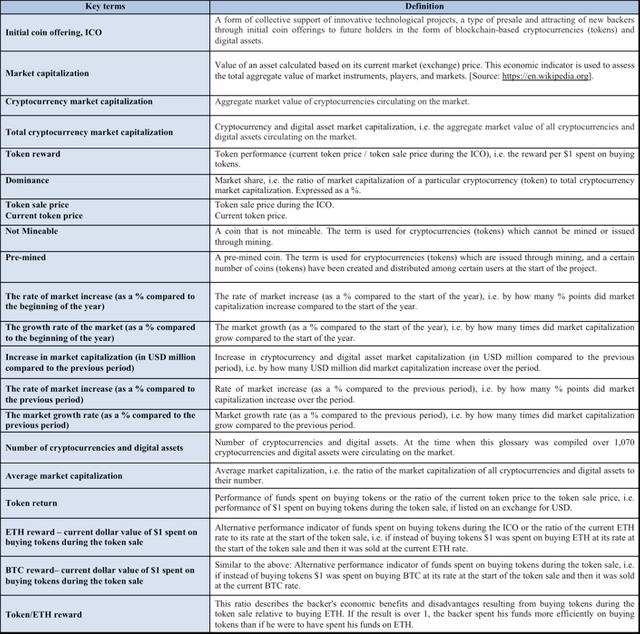
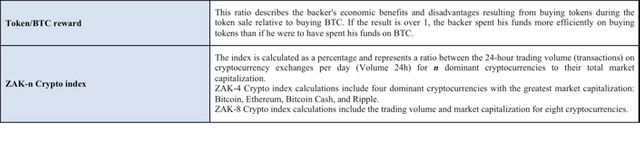
The Glossary is given in the Annex.
Annex
Glossary