The Fall Of The Mexican Peso
Last week we discussed how yen and emerging markets (such as the Mexican peso) were being sold and currencies like the U.S. dollar and the euro were bought. Our reasoning was that Japan’s largest pension fund (GPIF) was selling yen for reallocation. At the time, stock markets were not as fearful of the spread of the coronavirus as they have been over the last few days. As stock indices have been moving lower around the world, more fuel has been added to the fire for a weakening Mexican peso.
At the time of last week’s writing, USD/MXN had just broken higher and closed at the top of the small blue channel within the larger green channel, near 18.85. Since then, the pair has sliced through resistance at the top of the larger green channel, the 200-day moving average and the bottom trendline of the longer-term triangle and 50% retracement level from the August 29 highs to the February 17 lows. If stocks continue to move lower, dips will be bought. Next resistance is at the 61.8% Fibonacci retracement level of the same period near 19.60 and the top downward sloping trendline of the longer-term triangle near 19.95/20.00. Note that the RSI is in overbought territory. However, when markets are in strong trends, oscillators such as the RSI can become “more overbought.”
Daily USD/MXN 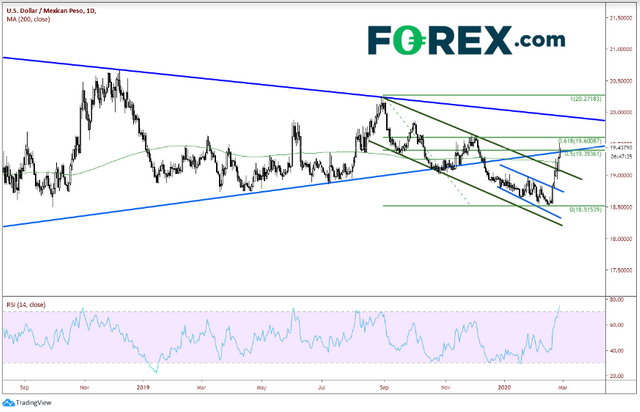 Daily USD/MXNSource: Tradingview, FOREX.com
On a 240-minute timeframe, support is back at the 50% retracement level and the upward sloping trendline from the long-term triangle near 19.40. Below that is small horizontal support at 19.2620 and below that at the downward sloping green channel trendline near 19.05. The RSI is diverging in overbought territory, however, as previously mentioned, oscillators can not be relied upon during strong trends.
4-Hour USD/MXN 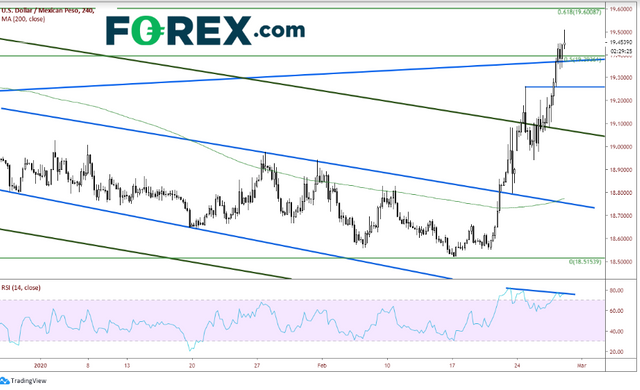 4-Hour USD/MXNSource: Tradingview, FOREX.com
Yesterday, we discussed how EUR/USD has been bid this week despite stock indices moving lower. The reasoning was due to the unwind of the carry trade. Today a new factor was thrown into the euro mix, which may help euro pairs continue to move higher: The German government is considering a possible stimulus program in case the coronavirus epidemic hits the German economy Hard (Handelsblatt). These factors have helped send EUR/MXN soaring over the past week.
Last week, price in EUR/MXN broke out of a falling wedge, which targeted 21.00.
4-Hour EUR/MXN 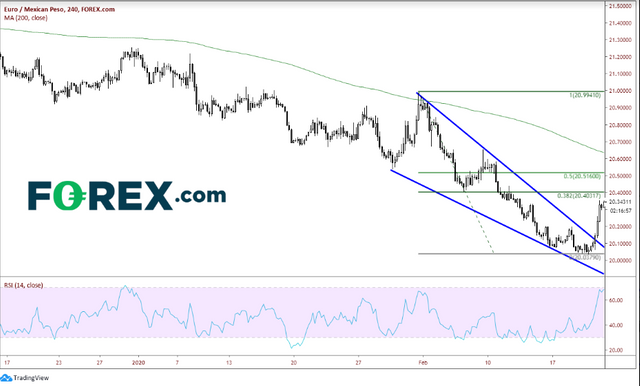 4-Hour EUR/MXNSource: Tradingview, FOREX.com
On a daily timeframe, we can see that price has broken through the target level at 21.00 and then some. EUR/MXN has traded up to a high today near 21.44. Resistance above is at 21.50/21.58, which is a confluence of Fibonacci levels and Fibonacci extensions. Above there is horizontal resistance at 21.75 and finally the highs from August 26, 2019 at 22.46. There is near-term support at the 200-day moving average at 21.32, however below that the next level of support isn’t until the day’s lows and top of the falling wedge at 21.00.
Daily EUR/MXN 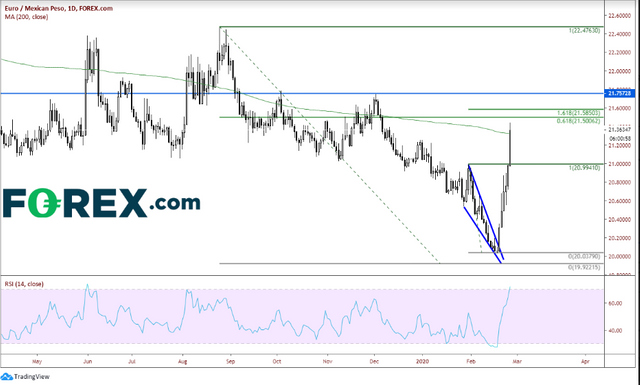 Daily EUR/MXNSource: Tradingview, FOREX.com
As long as stocks are moving lower, the carry trade should continue to unwind. Add in German stimulus and official selling of yen, and EUR/MXN and USD/MNX should remain bid. (With stocks off nearly 10% from highs and USD/JPY hanging around 110, it appears someone is selling yen near these levels). However, be weary of a bounce in stocks as there is always the possibility of profit taking/stop-loss run. Buyers will be looking for pullbacks to support to get long the peso pairs.