USD/JPY And Stocks The Latest Casualties Of The Coronavirus
Earlier yesterday, one of the issues we pondered regarding the coronavirus was that USD/JPY was only down 40 pips from the day’s highs, while stocks were getting hammered and gold was flying.
Where was the “flight to safety”? USD/JPY and stock indices are supposed to move together. As stocks indices move lower, there is a tendency to buy yen. Below is a 240-minute chart of USD/JPY. The green panel below shows the correlation between USD/JPY and the S&P 500.
Notice that as USD/JPY began to move higher earlier last week, the correlation began to move lower. Stocks weren’t “buying into” the USD/JPY move (which is one of the reasons to consider it was the GPIF reallocation out of yen and into USD). As a matter of fact, when USD/JPY was topping, the correlation actually went negative! But look at what happened on yesterday’s stock market open, the correlation went positive again. USD/JPY and stocks began moving together. Yen became the “flight to safety”!
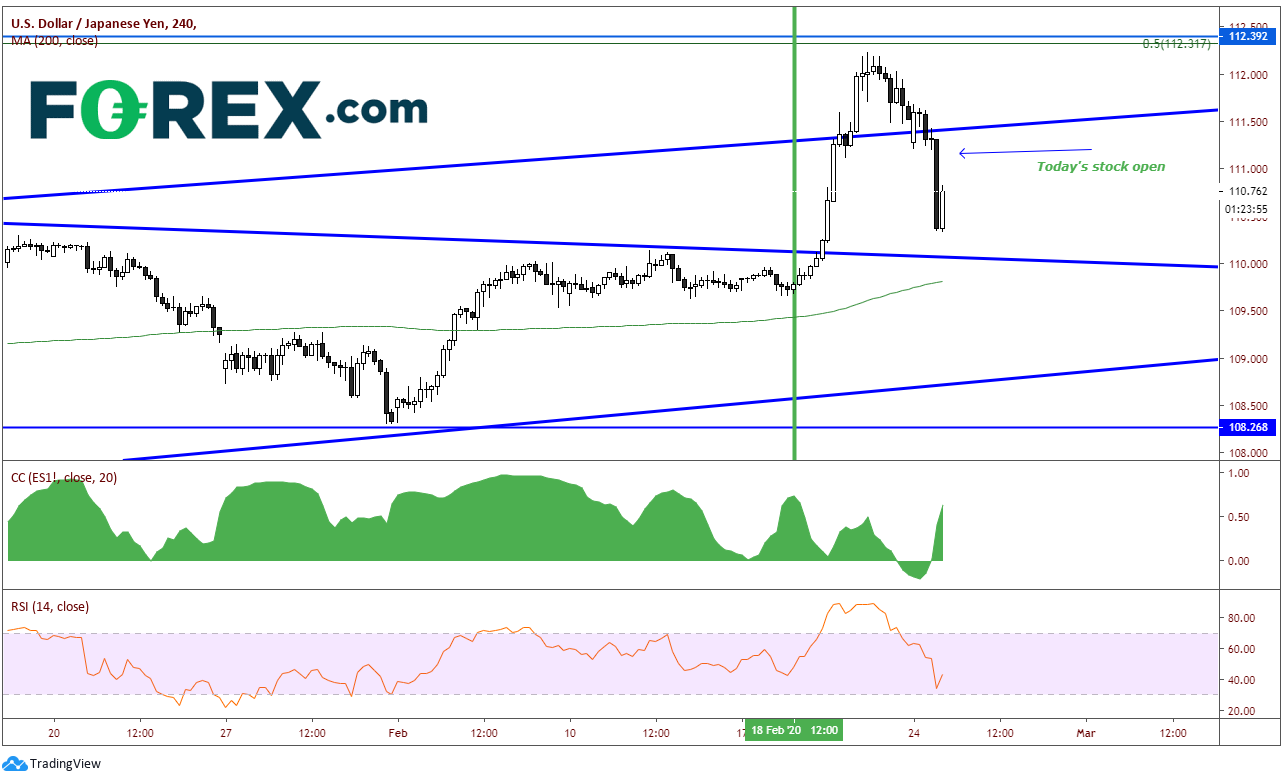
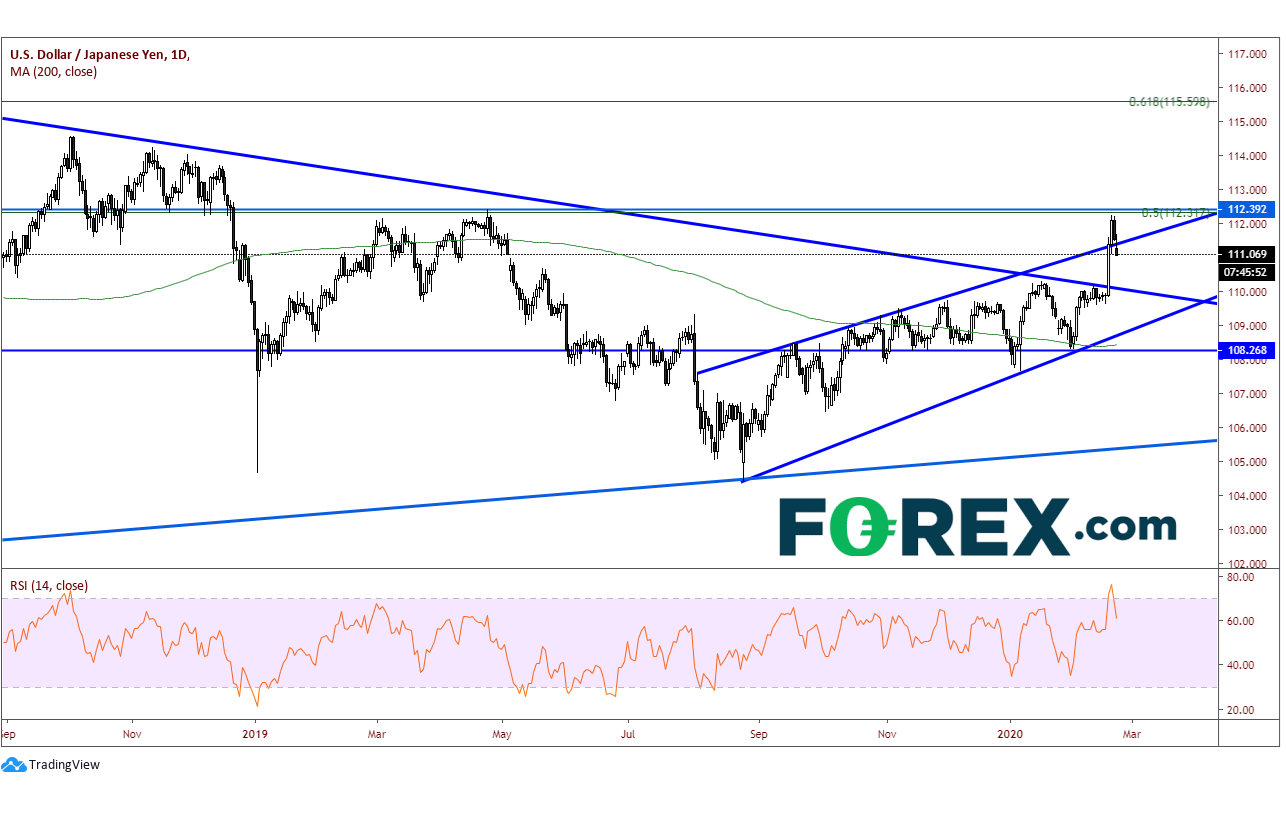
As we noted earlier, 110.30/50 is a support zone, which was prior highs (now acting as support), and the downward sloping trendline from the long-term symmetrical triangle. Price traded down there and was bought. Below that support is at 110.00, some horizontal support at 109.30, then way down at the February 3rd lows, the 200 Day Moving Average and the upward sloping trendline channel support from later August, all around 108.30/50. If stocks keep moving lower these are the levels to watch. However, if the correlation between stocks and USD/JPY becomes negative again, all bets are off the table.
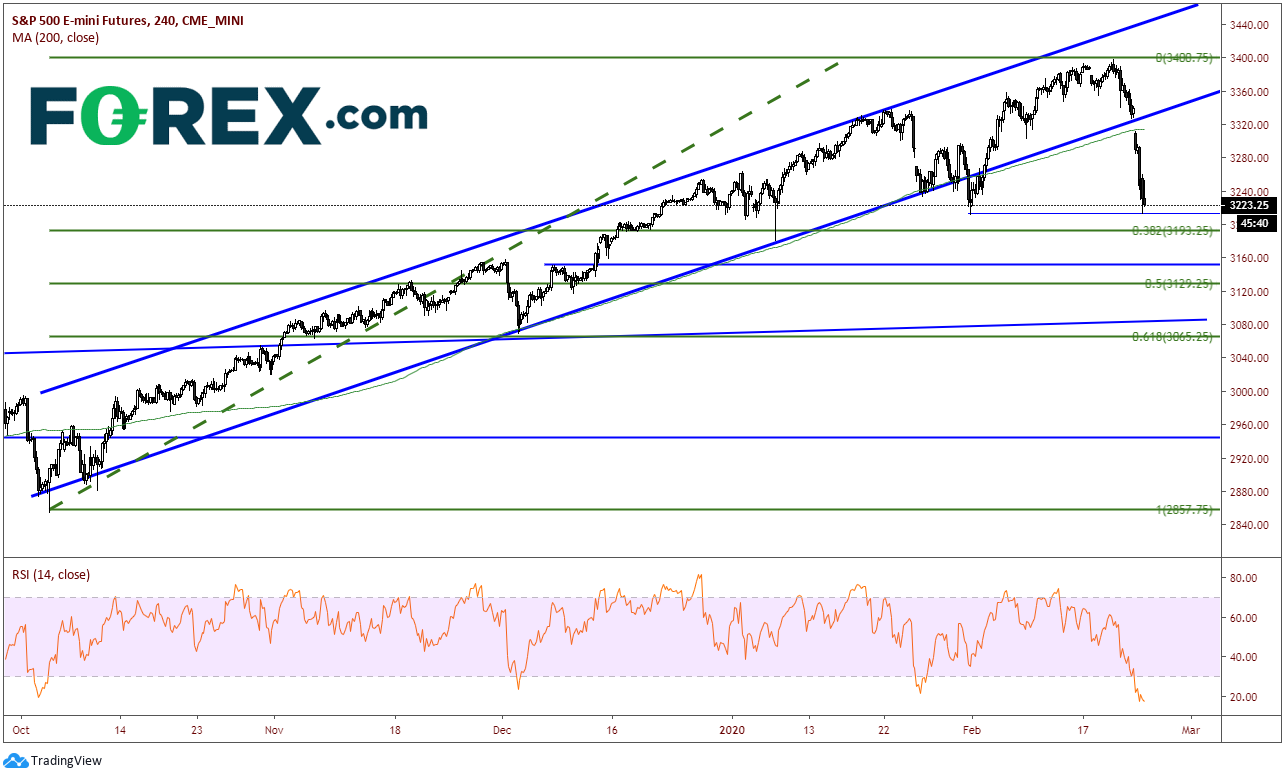
But where will the carnage end for stocks? The S&P 500 and the Down Jones are both down over 3.25%! Where can the S&P 500 stop (or at least pause)? There is horizontal support at yesterday’s lows from January 31st at 3222. In addition, the RSI on the 240-minute is at extreme oversold (below 20), so we may see a “bounce” soon. The next level is 3193.25, which is the 38.2% Fibonacci retracement level from the low on October 3rd to the highs on February 19th. Below that is horizontal support near 3150, then the 50% retracement level from the same time period at 3129.25. Resistance is 100 handles higher at the gap open near 3330.
Although the coronavirus appears to be spreading and things look bad for global growth, keep in mind that stocks have been bought on dips over the last 10 years. Don’t be surprised to see a bounce or reversal soon. However, this time it may be the bounce to sell into!