BITCOIN AND ETHEREUM TECHNICAL ANALYIS PRICE #4 ON 27th JULY’17

BITCOIN PRICE KEY HIGHLIGHTS
Today price of Bitcoin seems to be drawing support around the area of interest at the middle of its range.
Previously price broke belowa short-term consolidation pattern to show that sellers have regained control.
There are various support zones still nearby that might pave the way for a bounce back to the highs.
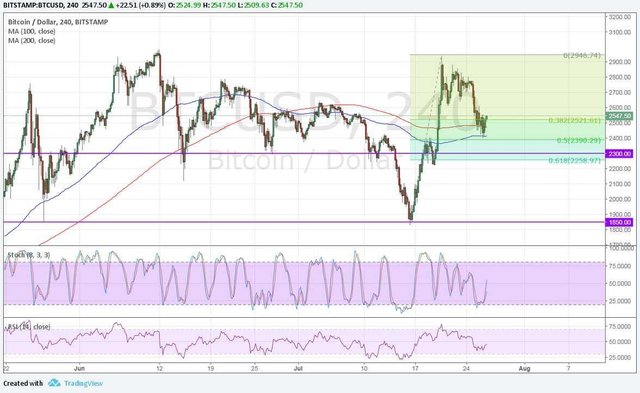

Price of bitcoin is stalling close to the mid-range area of interest, which happens to be bounded by a couple of Fib levels.
ETHEREUM KEY HIGHLIGHTS
Price of ETH was seen trading in the range around $200-205 against the US Dollar and lacked bullish momentum.
Short-term contracting triangle pattern with resistance of $203 which forms on the hourly chart of ETH/USD.
The triangle support at $195 on the downside, in the near term holds a lot of value.
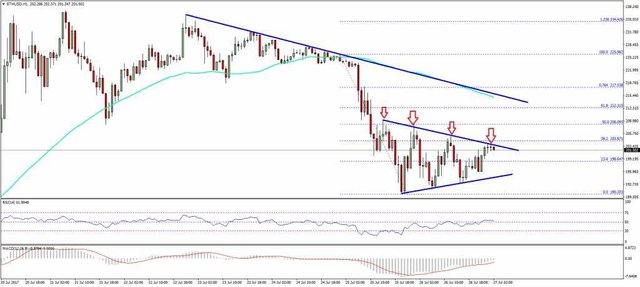

Price of Ethereum is trading with a neutral bias against the US Dollar and Bitcoin. Now, ETH/USD above $205 has to gain bullish momentum for more gains.The triangle support at $95 on downside, holds a lot of value in the near term. The price is above $190 alongated and there is a chance in the near term of a move towards $212 -215
HOURLY MACD – The MACD bearish slope is slowely reducing .
HOURLY RSI – The RSI is currently above the 50 level.
MAJOR SUPPORT LEVEL- $190
MAJOR RESISTANCE LEVEL- $205
Hi friend, very good !!!!!
You would help me with a vote in my post., Thanks !!! ;)