Bitcoin exactly 2 years ago 11/17/2015
Bitcoin Price Recovering From Last Week’s Nosedive!
Bitcoin price continued rising earlier today to print a high of $350. The buying volume of the market is rising as reflected by the market’s volume depth graphs on bitfinex and bitstamp. It seems that bitcoin price will continue rising during the next few hours to test again the %23.6 retracement level at ($341) according to the Fibonacci retracement we plotted on our analysis on the 12th of November.
Bullish Candlesticks on the 1 Hour Charts:
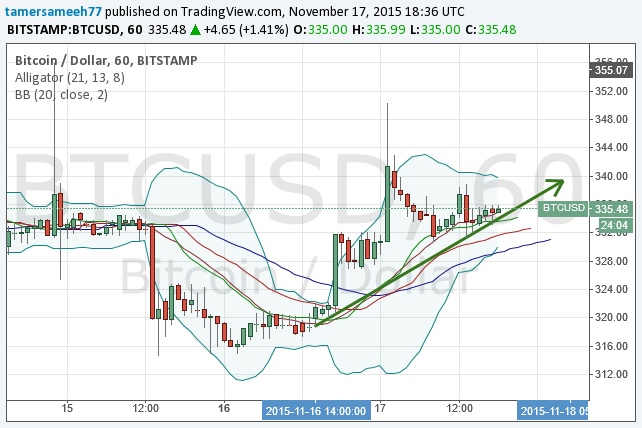
By examining the 1 hour (BTC/USD) charts from Bitstamp (look at the below chart), plotting the Bollinger bands and executing the William’s Alligator indicator, we can notice the following:
Today’s trading sessions on Bitstamp led to the formation of 7 greenish bullsih candlesticks, as opposed to only 3 reddish bearish candlesticks. A high of around $350 was scored after breaching the resistance that corresponds to the 23.6% Fibonacci retracement level ($341); however, it dropped now to $335.
Despite today’s earlier price drop, we can now plot a new uptrend line (the green trend line on the below chart) that started pushing the price North since yesterday at 14:00 GMT. Bitcoin price is now well below the Bollinger upper band, so conditions are favorable to see it rise to test the resistance at $341 again within the next few hours, especially that the candlesicks on the 1 hour charts started to exhibit long downwards shadows, which reflects the current buying power of the market.
William’s alligator indicator alignment is in favor of continuation of the price surge (green above red and blue below both).

Bitcoin Oversold On 1 Day Charts:
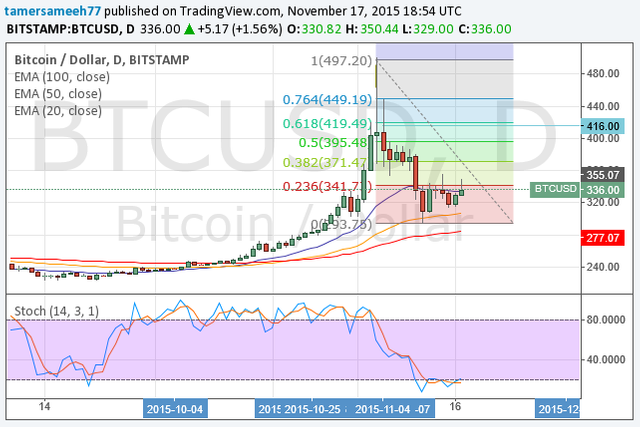
By studying 1 day (BTC/USD) charts from Bitstamp (look at the below chart), keeping the Fibonaccie retracements we plotted last week, plotting the 20,50 and 100 EMAs and executing the stochastic oscialltor, we can conclude the following:
Bitcoin price broke the resistance at $341 earlier today, but dropped below it later on; however, as the price is now higher than the 20 and 50 EMAs, we expect it to test the $341 level again soon.
The Stochastic oscillator value is now below 40 which reflects an oversold market, so we can expect a price surge soon that can push the stochastic value to more stable levels.

Conclusion:
Bitcoin price scored a high of $350 earlier today. Our technical analysis is in favor of continuation of the current buying power of the market, so we can see the price stabilize above $341 soon.
Charts from Bitstamp, hosted on Tradingview.com