Bulls Gearing Up For A Battle At The 200-days EMA – Where Will Ripple (XRP) End Up?
- XRP fell by 3.5% over the past 24 hours of trading as the cryptocurrency finds support at $0.27.
- The momentum now is firmly in the bearish trajectory as the RSI failed to break back above 50.
XRP saw a 3.5% price fall over the past 24 hours of trading, bringing the price for XRP beneath $0.28 as it reaches $0.272. This latest price decline is largely a result of Bitcoin failing to break the $10,000 level.
XRP has now set a new bearish trajectory and if it breaks beneath the 200-days EMA we can expect the bearish pressure to continue to drive the cryptocurrency toward $0.25.
XRP Price Analysis
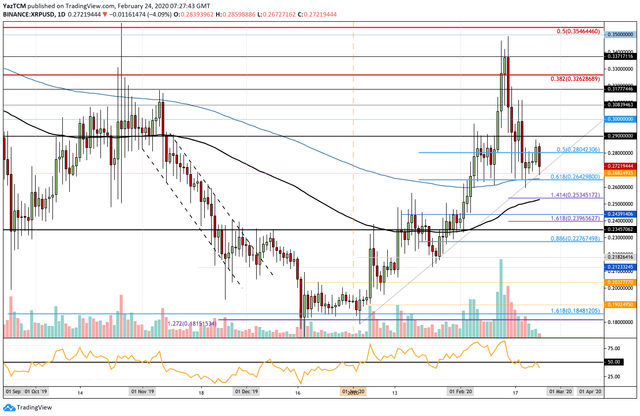
XRP/USD – Daily CHART – SHORT TERM
Market Overview
Since our last analysis, XRP attempted to climb higher from the support at $0.268, however, it was unable to get anywhere near the $0.29 level before it rolled over and started to fall. The latest price decline has pushed XRP back toward $0.268 as the buyers gear up for a battle at the 200-days EMA.
Short term prediction: NEUTRAL
XRP still trades in neutral trading conditions and would need to drop beneath the support at $0.253 (100-days EMA) before becoming in danger of turning bearish in the short term.
The first level of support toward the downside, the first level of support lies at $0.268. This is then followed with more support at $0.264 which is the support provided by the 200-days EMA and further bolstered by the short term .618 Fibonacci Retracement level.
If the selling continues beneath the 200-days EMA, support can be found at $0.26, $0.253 (downside 1.414 Fib Extension & 100-days EMA), and $0.25.
On the other side, resistance lies at $0.28, $0.285, $0.29, and $0.30.
The RSI attempted to break back above the 50 level, however, it failed miserably and is pointing downward again. This confirms that the momentum is certainly within the seller’s favor. For any form of market recovery, we would need to see the RSI rising and breaking back above 50.
Key Levels:
Support: $0.268, $0.264, $0.26, $0.25, $0.243.
Resistance: $0.28, $0.285, $0.29, $0.30, $0.308, $0.3177, $0.326, $0.377.
Image from TradingView
Follow CoinGape on social media handles and stay updated!
Telegram | Twitter | Medium