Qtum Price Forecast - 30th August

Price Forecast Report for Qtum — 30th August 2017
Welcome to the Price Forecast Report for Qtum — 30th August 2017.
This report investigates 4 popular technical analysis indicators:
- Moving Average Convergence Divergence
- Relative Strength Index
- Aroon Indicator
- On-Balance Volume
The above indicators are used in technical analysis as tools for forecasting the direction of prices through the study of past market data, primarily price and volume.
They are based on the idea that the market for buying and selling digital currencies is not efficient and historic prices can be used to predict future price movements, and using these tools can be advantageous to investors and traders.
Moving Average Convergence Divergence (MACD)
Moving average convergence divergence (MACD) is a trend-following indicator of momentum that illustrates the relationship between two moving averages of prices. The MACD is estimated by subtracting the 26-day exponential moving average from the 12-day moving average. A nine-day exponential moving average of the MACD, the "signal line", is then plotted on top of the MACD, functioning as an identifier for both buy and sell signals.
The graph below shows the MACD applied to the price of Qtum using daily price data for the last 40 days.
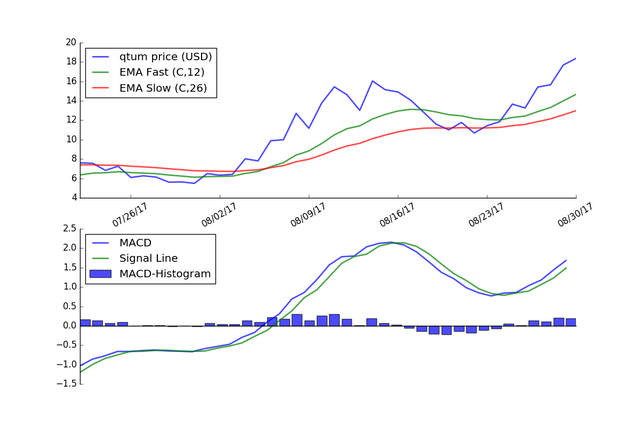
As shown in the chart above, the MACD is currently above the signal line, implying a bullish signal, indicating that it may be an optimal time to buy.
According to the MACD, a bullish signal suggests that the price of the asset is likely to experience upward momentum.
Relative Strength Index (RSI)
The relative strength index (RSI) is another price momentum indicator that compares the size of recent gains and losses over a specified time period to calculate speed and change of price movements of a digital currency. It is mainly used to identify overbought or oversold situations in the trading of a digital currency.
RSI values of 70 or above are traditionally seen to indicate that a security is becoming overbought or overvalued, and therefore may be set for a trend reversal or corrective reduction in the price. On the other side, an RSI reading of below 30 is generally interpreted as indicating an oversold or undervalued condition that may signal a change in the direction of the price to the upside.
The graph below shows the RSI applied to the price of Steem based on daily price data for the last 40 days.
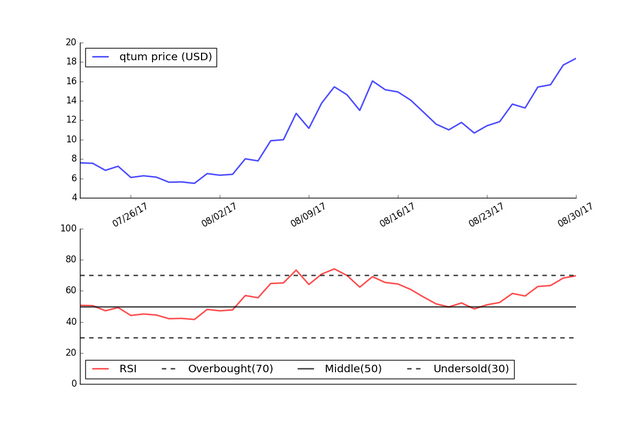
Since the RSI is currently between 30 and 70, this would indicate that Qtum is neither overbought or oversold and that no material price change is expected.
Aroon Indicator
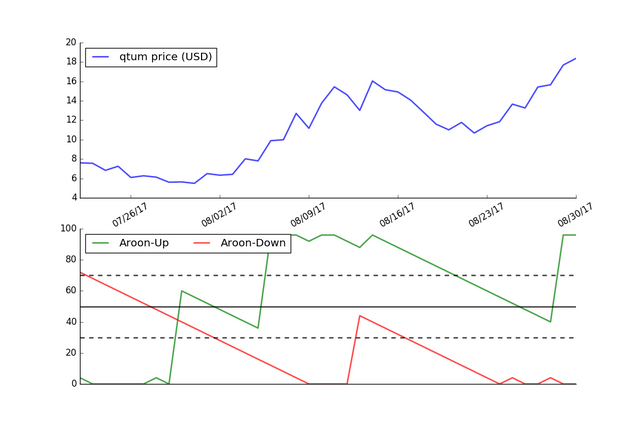
The Aroon indicator can be used to identify trends in digital currency prices and the likelihood that the trends will reverse. It is made up of two trend lines: an "Aroon up" line, which measures the magnitude of the uptrend, and an "Aroon down", which measures the size of a downtrend. The indicator reports the time it is taking for the price to reach, from a beginning point, the highest and lowest points over a given time period, each reported as a percentage of total time.
The graph below shows the Aroon Indicator using the price of Qtum over the last 40 days.
The Aroon indicators move above and below the centerline (50) and are bound between 0 and 100. These three levels can be explained as follows: When the Aroon-Up is above 50 and the Aroon-Down is below 50, the bulls have an edge. This indicates a greater propensity for new x-day highs than lows. The opposite is true for a downtrend. The bears have an edge when Aroon-Up is below 50 and Aroon-Down is above 50.
In the graph below, the Aroon-Up is above 50 and the Aroon-Down is below 50 indicating a bullish signal.
On-Balance Volume (OBV)
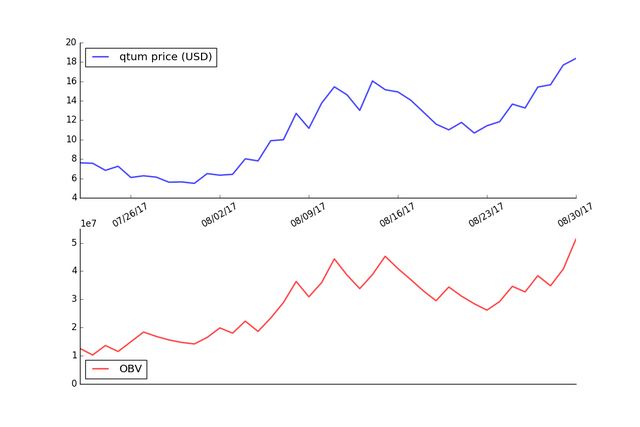
The OBV indicator can be used to measure the positive and negative movement of volume of a currency relative to its price over time.
The idea is that volume precedes price movement, so if a currency is experiencing an increasing OBV it is a signal that the level of volume traded is increasing on upward price moves. Decreases mean that the security is seeing growing levels of volume on down days.
The graph below shows the OBV applied to the price of Qtum using daily price data for the last 40 days.
Please note that the above indicators can give false trade signals and use of such tools should be treated with caution. Blindly using technical pricing indicators without a general knowledge of fundamentals or an understanding of the currency being analysed is not advisable.
Thank you for reading
Source of data: www.coinmarketcap.com
Welcome to Woldwide bittrex exchange pump channel
The bittrex force of Koreans is powerful.
Last year our pumping room was highly trusted.
Do you think 500% ~ 1500% profit is impossible in a week?
We'll show you this is true.
With accurate chart reading, we plan to periodically pump.
We are recruiting people all over the world, and we do not need your money for free!
Just watch it. Install the telegram app and get in the channel.
Join Telegram channels http://telegram.me/DvaPump
안녕하세요. bittrex 거래소 펌핑 방입니다.
저희 한국인들의 bittrex 세력과 펌핑은 매우 강력합니다.
작년에 저희 펌핑방은 각종 코인 펌핑으로 크게 신뢰를 쌓았으며,
법적문제가 현재 있지않아, 다시한번 여러분들께 역사를 다시 써나가려고합니다.
일주일에 500% ~ 1500% 수익이 불가능할 것 같나요?
저희가 보여드리겠습니다. 우리방만의 노하우와 진실을
정확한 차트 리딩과 함께 저희는 주기적으로 펌핑할 예정입니다.
현재 전세계 사람들을 모집하고있고, 회원님들 돈 강요하지 않습니다. 공짜입니다.
구경만 하셔도 좋으니 텔레그램 어플 설치하고 저희 채널에 들어와주세요 ^^
텔레그램 입장해주세요. http://telegram.me/Dvapump