Stocks Fell Sharply And May Have Further To Fall On March 4
What a wild trading session. Fed rate cuts, 1% swings in the final 30 minutes. I mean this is wild, look at the last 30 minutes on this chart, in 5-second increments. From 3:30 until 3:50, the S&P fell 1.5%, then increased by 1.2% and decreased again by 1.15%.
S&P 500 Index Chart 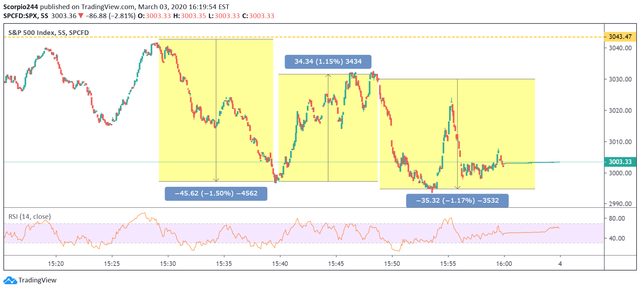 S&P 500 Index Chart
S&P 500 (SPY)
As I said at the beginning of the week, the only thing that matters is that we don’t go below 2,855—the rest of this action is non-sense at this point. Why the market didn’t rally yesterday on the Fed rate cut doesn’t matter. The market now needs to reset. That is what I believe it is now in the process of doing. The market is likely to continue slushing around the 2,900 to 3,100 region over the next few days, while it tries to find its footing.
S&P 500 Index 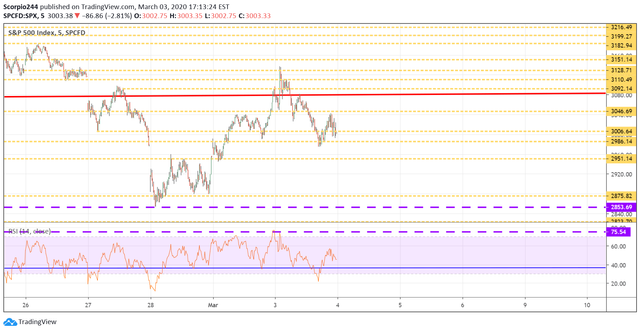 S&P 500 Index
The unfortunate thing is that today may be one of those days where we trade at the lower end of the range. It looks as if there is a head and shoulders pattern that has formed on the intraday charts, and it suggests over the very short-term, we trade down to around 2,950, and perhaps 2,875.
S&P 500 Index - 60 Min Chart 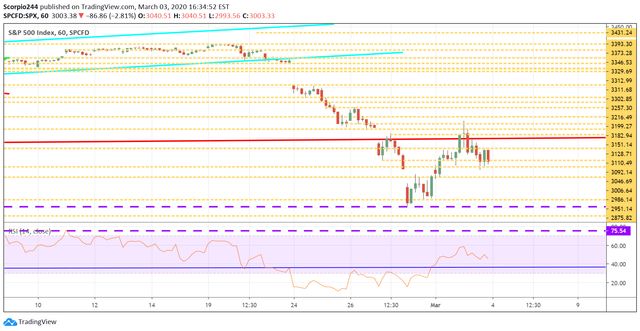 S&P 500 Index - 60 Min Chart
Is it possible for the S&P 500 to fall below 2,855? Sure. Will it? I haven’t a clue. I don’t think it will, but what I think doesn’t matter.
YIELDS
US10
Y-DE10
Y Daily Chart 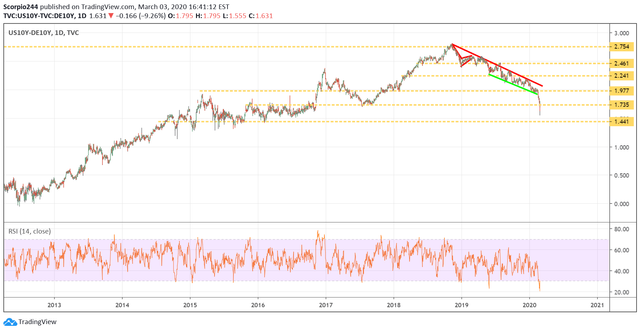 US10
US10
Y-DE10
Y Daily Chart
Anyway, 10-year yields fell sharply to around 92 basis points. Based on the current spread between US and German bonds, they may not even be finished falling.
US30
Y-US20
Y Daily Chart 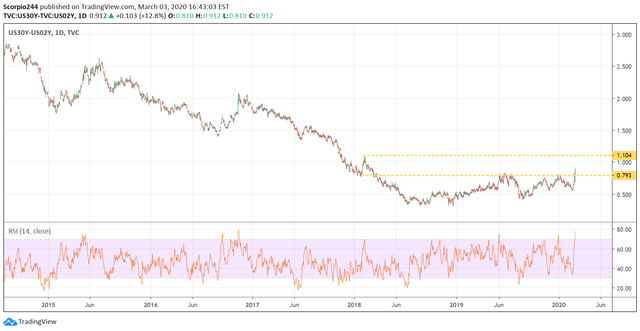 US30
US30
Y-US20
Y Daily Chart
Meanwhile, the spread between the 30-year and 2-year widened, and could still widen further. It also seems to suggest that 2-years yields are likely to continue to drop in the future.
So we can continue to watch and wait.
ROKU (ROKU)
Roku was down sharply, along with everything else. The stock is trying to hold on to support around $105 – $106, but I’m not sure how much longer that level can hold. $100 is still the next level to watch for, with $94 after that.
Roku Inc Chart 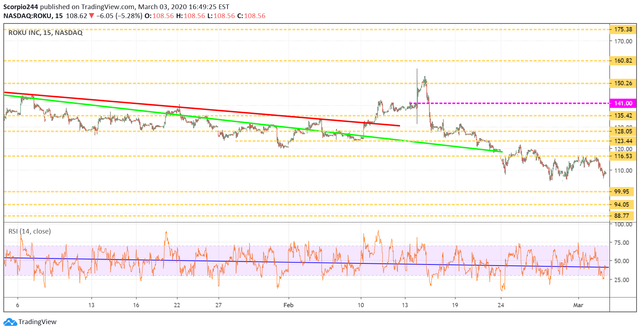 Roku Inc Chart
SQUARE (SQ)
Square (NYSE:SQ) has been holding up amazingly well, and yesterday I saw some bullish options betting that indicates the stock rises to around $91 by June.
Square Inc Hourly Chart 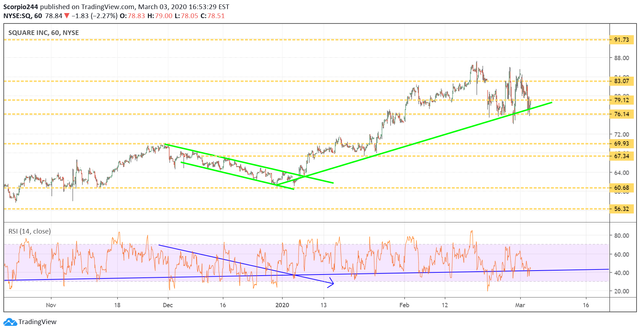 Square Inc Hourly Chart
ALIBABA (BABA)
Alibaba (NYSE:BABA) continues to hold up very well around $211, and I have to think that it has to be a good thing.
Alibaba Ltd Hourly Chart 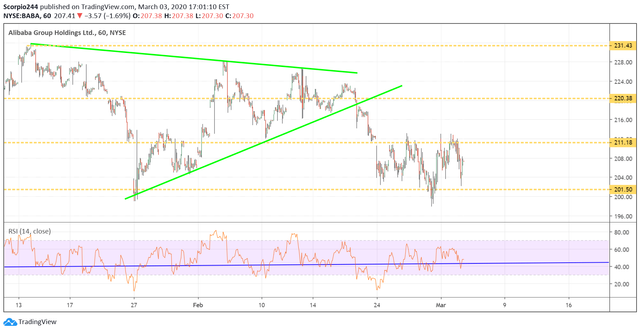 Alibaba Ltd Hourly Chart
DISNEY (DIS)
Disney (NYSE:DIS) dropped yesterday, and the good news is that it held the lows. If Disney could turn, that would be a positive sign.
Walt Disney Chart 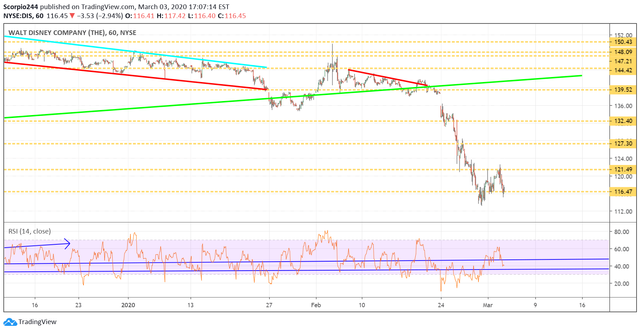 Walt Disney Chart
NETFLIX (NFLX)
Netflix (NASDAQ:NFLX) continues to consolidate in this wide trading range between $363 and $386, fine by me.
Netflix Inc Chart 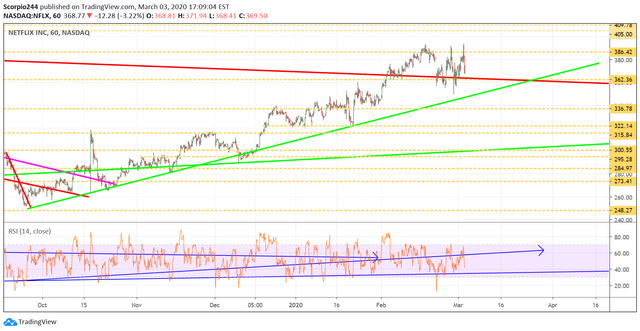 Netflix Inc Chart
The Steem blockchain is currently being attacked by a central authority in order to take control of the witnesses. If you are not managing your witness votes, please consider setting @berniesanders as your witness voting proxy by clicking here to help restore the decentralization of Steem.