Russell 2000 Loses Nearly 10% In Strong, Quick Drop
Another big hit to markets yesterday sent indices spinning lower. The Russell 2000 (via i
Shares Russell 2000 ETF (NYSE:IWM)) took the worst of it with a 9.7% loss, closing at the low of the day on higher volume distribution. The loss has been so strong and so quick it has moved down to the 5% zone of historically weak action dating back to 1987; this is a 'buy' zone opportunity, although I would like to see some stability in price action before confirming this as swing low.
However, if you are investor with a long term window, now is a time to be building up a position.
IWM Daily 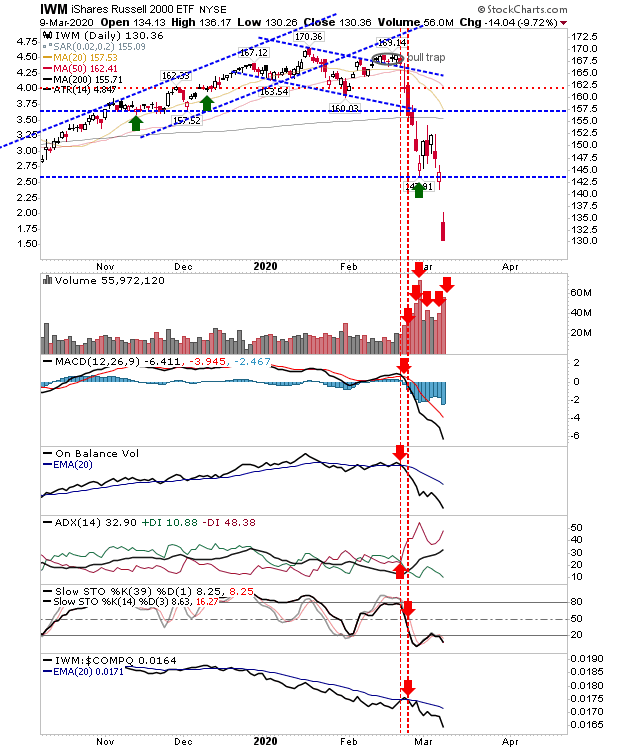 IWM Daily
The S&P 500 finished the day 10% below its 200-day MA, which is just shy of the 5% of historic weak action going back to 1950; last month, the index was trading in a 'sell' zone of historic strong action—now it has come full circle for traders, trading inside the 'buy' zone. Volume surged in confirmed distribution with technicals net negative, while relative performance against Small Caps charged higher
SPX Daily 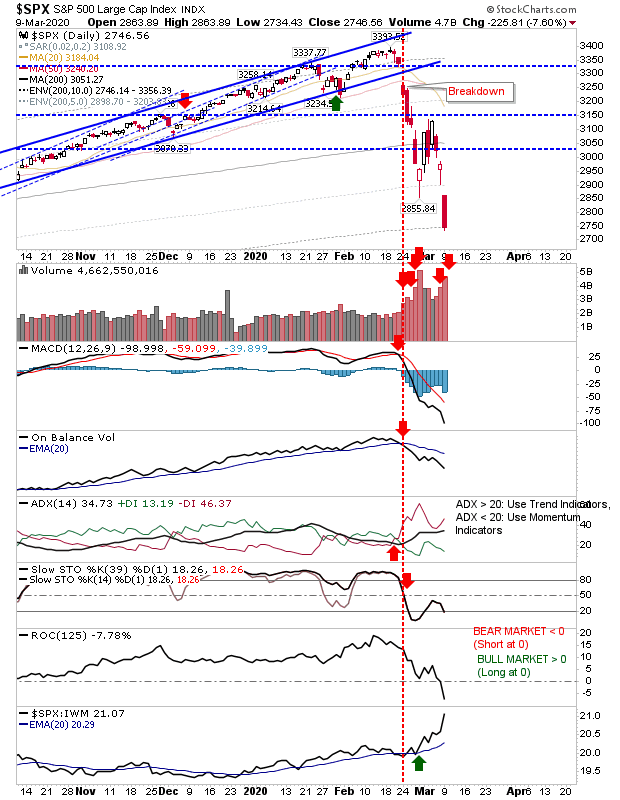 SPX Daily
The last index is the NASDAQ. As one of the stronger indices it didn't undercut its 200-day MA as much as the S&P or Russell 2000. It did, however, manage to finish at the lows of the day on confirmed distribution as the 7%+ loss will do little to ease confidence.
COMPQ Daily 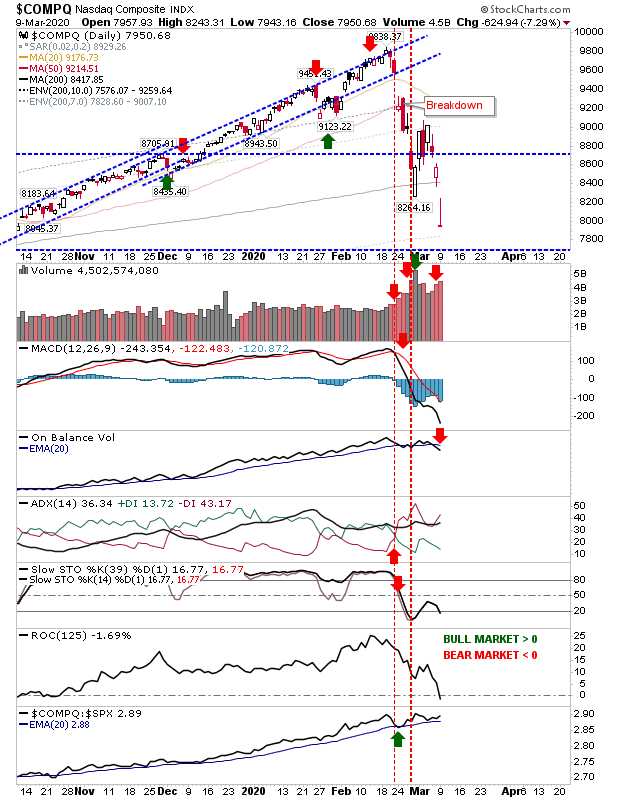 COMPQ Daily
With indices having swung from extreme overbought to oversold in the space of two months, what markets need now is a period of consolidation to digest losses. However, the Coronavirus remains an unknown as to its impact on supply chains, manufacturing and consumer demand. Add to that an oil price war and a Trump administration incapable of managing the crisis and it's hard to see where this may stall.
However, smart traders will know when to react; if indices end up trading 25% below their 200-day MA it will mark a scenario where losses are in 1% zone of worst historic action. While that is a situation which is unlikely to look like a good time to buy, hindsight has often shown it to be positive. The table below has been updated to reflect some loss scenarios.
Top and Bottom Percentiles 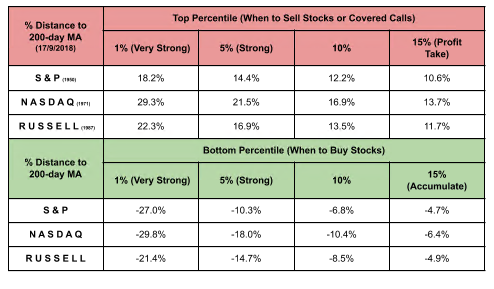 Top and Bottom Percentiles