Classic Volume Price Analysis Lessons On The ES Emini Daily Chart
ES Daily Chart 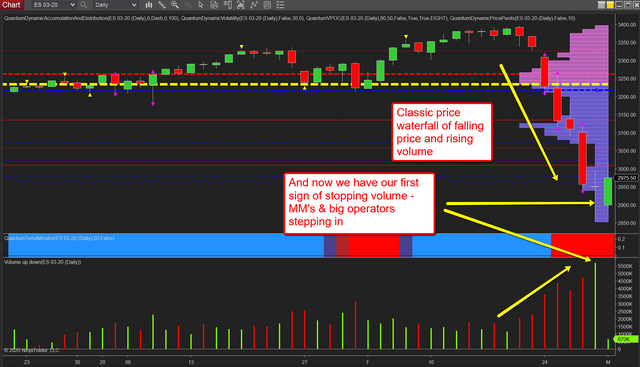 ES Daily Chart
The daily chart for the ES Emini offers classic lessons in volume price analysis 101, a lesson which is also being played out on the NQ and the YM Emini futures in the same way.
If we start with last week’s price action driven by panic, the price waterfall which duly developed was classic with rising volume as the market collapsed with volume confirming price and vice versa.
Then on Friday, what do we see, another day of panic selling but one which was overwhelmed with buying as sentiment reversed late in the day on comments from the Federal Reserve, with the index closing with a deep wick to the lower body and back near the open, but on extreme volume. The highest of the week.
This is stopping volume, but after such a dramatic plunge, unlikely the market can absorb all of the selling in one effort, and over a relatively short period of a few hours. But, this is the first signal, the market makers are now stepping in to calm the markets and buy heavily now this profitable campaign is reaching its conclusion.
Now what we expect to see is further absorption of the selling pressure in a congestion phase, followed by a successful low volume test, before the recovery begins in earnest.