SPX Retreats From The Outer Limits
As of Monday's close (2746.56) (it's a full moon today), the S&P 500 Index (SPX) is -18.89% from its peak at 3393.52 on February 19 -- just 1.11% from reaching 'bear market' status -- amid a sea of red following a meltdown in global markets.
Indices 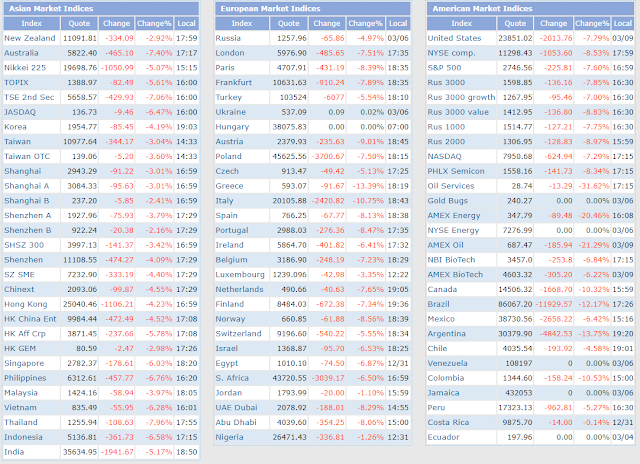 Indices
WORLD MARKET INDICES (Source: indexq.org)
Prior to its massive 13-day purge, it touched the outer limits (+5 standard deviation) of its long-term uptrending regression channel, as shown on the following 20-year monthly chart.
SPX major support lies another 150 points, or so, below Monday's close, around 2600 (blue line). That level is a convergence of:
- its 50-month moving average (red)
- the -1 standard deviation level of this channel
- the upper edge of the value area (blue line) of a 10-year weekly TPO Profile, as shown on the weekly chart of the S&P 500 E-mini Futures Index (ES), below
- the lower edge of the value area (blue line) of a 2-year daily TPO Profile, as shown on the daily chart of the S&P 500 E-mini Futures Index (ES), below (as more fully discussed in this recent post)
SPX Chart 20-Year 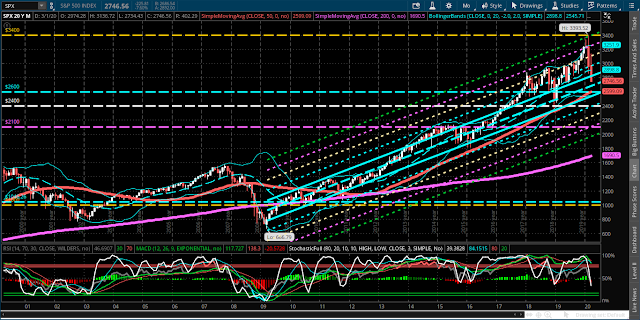 SPX Chart 20-Year
SPX 20-Yr. Monthly
SPX Chart 10 Year Weekly 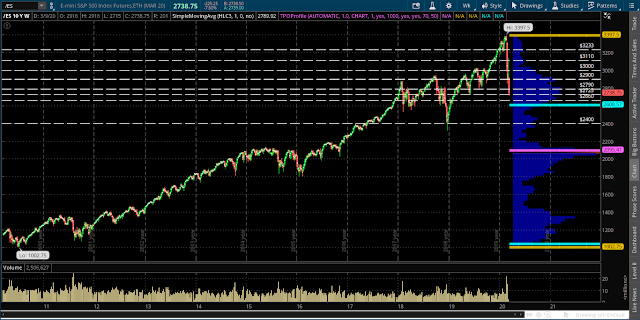 SPX Chart 10 Year Weekly
ES 10-Yr. Weekly
SPX 2 Year Daily Chart 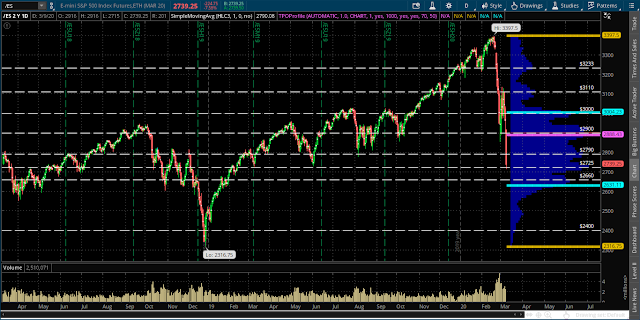 SPX 2 Year Daily Chart
ES 2-Yr. Daily
BOTTOM LINE:
We may see the SPX slide further down to around 2600, or lower, before it begins to stabilize, inasmuch as accelerating downside momentum (rate of change shown with an input value of one period in histogram format) has not yet reached a new 20-year extreme capitulation level, as shown on the following 20-year monthly chart of the SPX.
Keep an eye on the above-referenced levels, together with my recent posts here and here, which describe other gauges that I'm monitoring in the near term for possible clues as to SPX directional moves.
SPX Monthly - Trading View 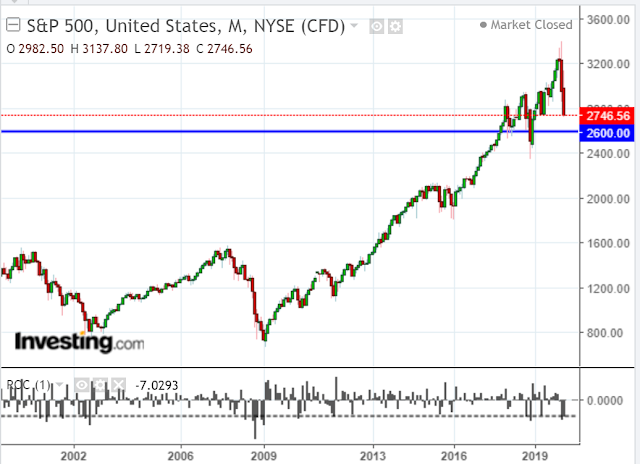 SPX Monthly - Trading View
SPX 20-Yr. Monthly