S&P 500 Cash Index Breaks Below An Upside Line
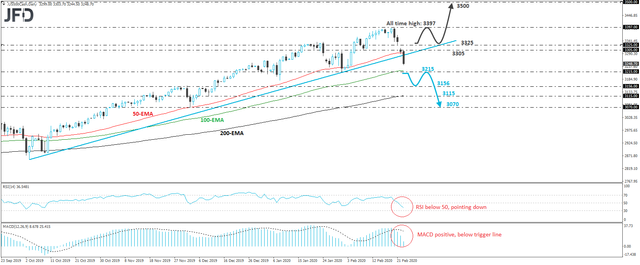
The S&P 500 cash index gapped lower today, and continued to drift south, breaking below the upside support line drawn from the low of October 3rd. This suggests that the actual index will open with a big negative gap today. In our view, the break below the upside line suggests that the outlook has turned somewhat negative, but we prefer to wait for a break below 3215 before we get more confident on that front.
Such a move may confirm a forthcoming lower low and also signal the completion of a non-failure swing top formation. The bears could then get more-than-willing to drive the price towards the 3156 zone, which provided decent resistance from November 27th until December 12th, when it was broken to the upside. Another dip, below 3156, may allow a test near the low of December 10th, at around 3115. If the sellers are not willing to stop there either, then we could see extensions towards the 3070 territory, defined as a support by the low of December 3rd.
Shifting attention to our daily oscillators, we see that the RSI lies below 50 and points down, while the MACD, although positive, stands below its trigger line, pointing south as well. Both indicators suggest that there is ample room for the index to continue drifting south for a while more.
On the upside, we would like to see a rebound above 3325 before we abandon the bearish case. This would also bring the price back above the aforementioned upside line and may allow buyers to aim for another test near the all-time high of 3397. If they don’t hit the brakes near that zone, the index would be brought into unchartered territory with the next possible resistance perhaps being the psychological zone of 3500.
S&P 500 cash index daily chart technical analysis  S&P 500 cash index daily chart technical analysis