Technical Outlook: SPX, Gold And GDX
SPX Monitoring purposes; Long SPX on 2/24/20 at 3225.90
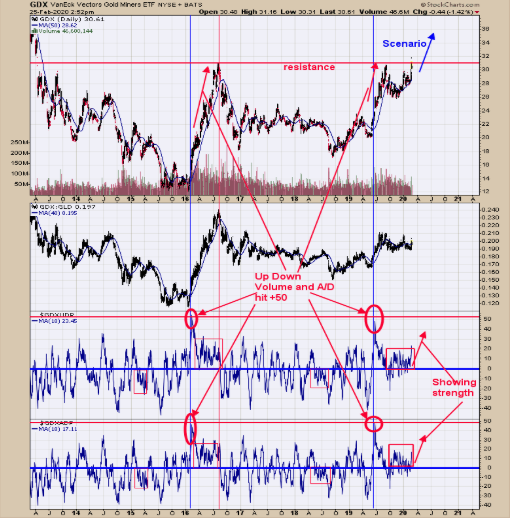
Monitoring purposes Gold: Long GDX on 1/29/19 at 21.96.
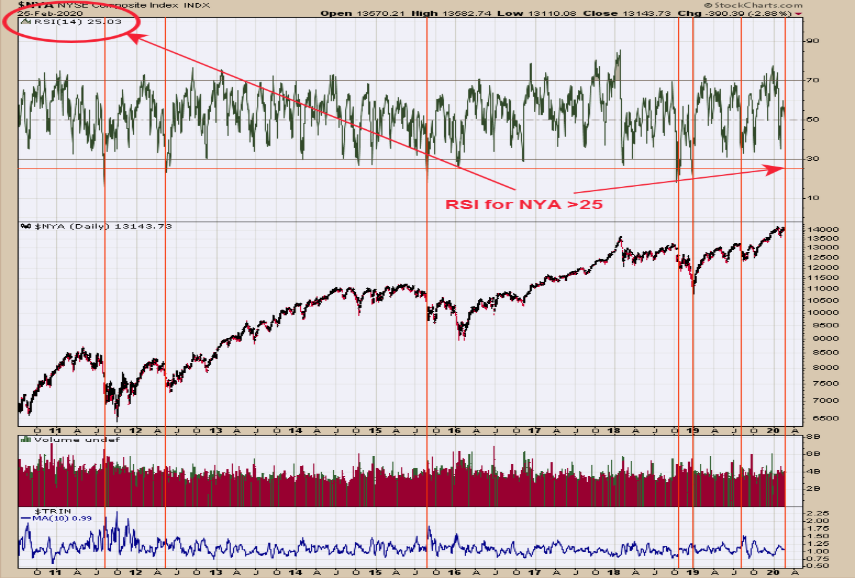
This chart is the daily NYA (NYSE Composite) with its RSI going back to late 2010. We labeled with red vertical lines when the RSI for the NYA fell below 25 (today’s close came in at 25.03). We did do back further then 2010 but the chart was hard to read and didn’t change the theory of any degree. Our point in this chart is that RSI momentum has reached a level where bounce can be expected in the NYA. Some 25 RSI levels came at major lows and others where trading ranges started. It obvious it would have been better to be long today rather than yesterday but condition suggests at a minimum a bounce is near. Follow us on twitter. @Ord
Oracle. Long SPX on 2/24/20 at 3225.90.
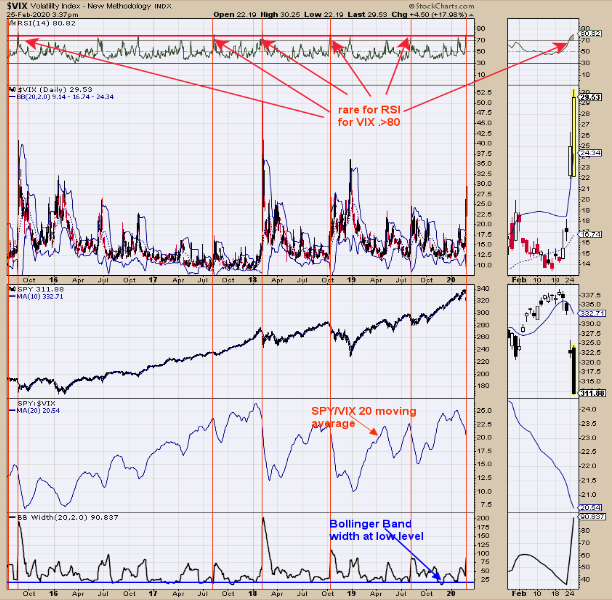
Some statistics; the last 20 times (going back to 2010) the market gapped down >3% (yesterday’s gap >3%) the market has higher 18 times (90%) by an average of 2.81% in five days; The two loss average 2.10%. SPX down four days in a row; closed higher 81% of the time within five days, average gain 1.2%. The Trin closed yesterday at 1.53 and the ticks closed at -261 and both are in panic levels. When Trin and Ticks reach panic levels market bottoms the same day as the readings to as late as two days later (two days later would be tomorrow). The top window in the chart above is the RSI for the VIX. RSI readings for the VIX above 75 is another form of panic and readings above 80 are rarer; today reached 80.82. This acceleration in the VIX usually leads to a snap back in the SPX. SPX (NYSE:SPY) could attempt to fill the down gap in the coming days. Different forms of panic are present on current decline, suggesting a bottom is near. Join us on twitter. @Ord
Oracle.