Visualizing Algorithms and Data Structures
This post comes from my Quora blog "Algorithms and data fusion". I thought that sharing some of my content on Quora here on Steemit would help users that do not use Quora.
Here are some references that help students to understand better data structures such as List, LinkedList, HashTable or HashMap, Trees or HashTrees and Sets.
By visualizing algorithms and each iteration step is much easier to understand how the algorithm works so here are some nice ways to do it.
1- Data Structure Visualization (https://www.cs.usfca.edu/~galles/visualization/Algorithms.html)
Visualization of the most important data structures. In the same link there are also some nice visualizations on Graph Algorithms as for example :
Dijkstra's Shortest Path
Prim's Minimum Cost Spanning Tree
Topological Sort (Using Indegree array)
Topological Sort (Using DFS)
Floyd-Warshall (all pairs shortest paths)
Kruskal Minimum Cost Spanning Tree Algorithm
2- Another one is visualising data structures and algorithms through animation (http://visualgo.net)
which has a great graphic design.
**3- I like very much also Page on ocks.org (https://bost.ocks.org/mike/algorithms/) from Mike Bostock. It is all visualization of algorithms in Javascript and it is amazing. It looks just like Art work.
**4- Visualize K-means clustering algorithm: **Visualizing K-Means Clustering (http://www.naftaliharris.com/blog/visualizing-k-means-clustering/)
as well as a clustering algorithm called DBSCAN which is great for finding points that may be clustered along ring shaped structures : Visualizing DBSCAN Clustering (http://www.naftaliharris.com/blog/visualizing-dbscan-clustering/)
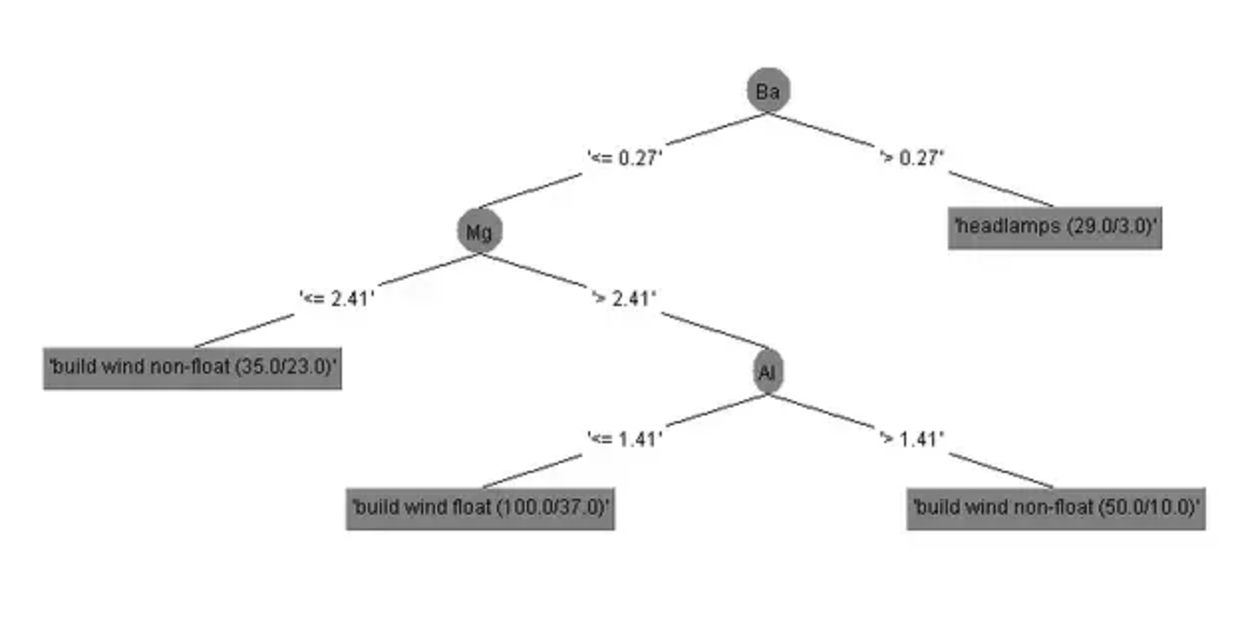
5- Weka machine learning framework is also a good way to visualize algorithms. In the graphics below a classification tree result of a J48 classification algorithm.

And as final clue here is a paper on the utility of visualizing algorithms for learning : https://www.researchgate.net/publication/3867735_Using_visualizations_to_learn_algorithms_Should_students_construct_their_own_or_view_an_expert%27s (https://www.researchgate.net/publication/3867735_Using_visualizations_to_learn_algorithms_Should_students_construct_their_own_or_view_an_expert%27s)
Looking for more visualization tools ? Have a look here for visualizing data in R or Java : DataTreeMap (http://www.datatreemap.com/dataviz.html)
Happy Learning :-)