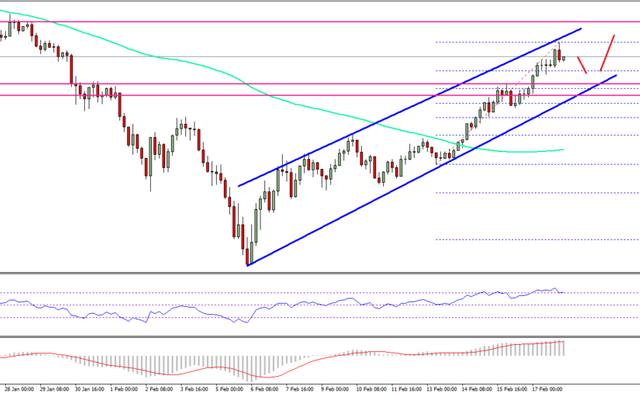
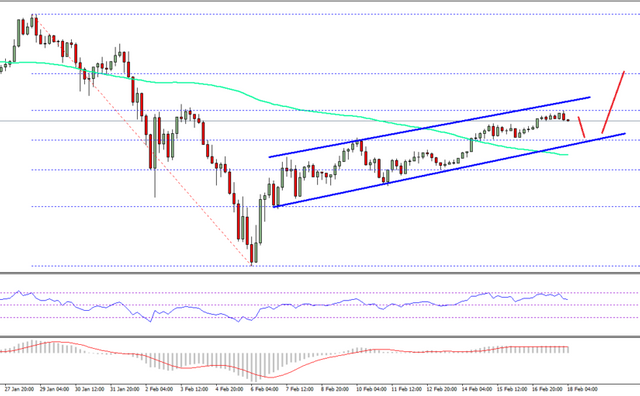
ANALYSIS: Bitcoin, Bitcoin Cash, Ethereum
Bitcoin Price Weekly Analysis
Key Points
Bitcoin price made a nice upside move and traded above $9,000 and $10,000 against the US Dollar.
There is a major ascending channel forming with current support at $10,150 on the 4-hours chart of the BTC/USD pair (data feed from SimpleFX).
The pair may continue to rise and the next major resistances are at $11,600 and $12,000.
Bitcoin price showing many bullish signs above $10,000 against the US Dollar. BTC/USD may correct a few points in the short term, but it remains supported above $10,150.
Bitcoin Price Support and Trend
This past week, buyers were in control as bitcoin price succeeded in breaking the $9,000 resistance area against the US Dollar. The upside move was strong and later the price even moved above the $10,000 level to register decent gains. The price is now comfortably placed well above the $10,000 level and the 100 simple moving average (4-hours). The recent high formed was at $11,160 from where the price started correcting lower.
An initial support is around the 23.6% Fib retracement level of the last wave from the $8,250 low to $11,160 high. More importantly, there is a major ascending channel forming with current support at $10,150 on the 4-hours chart of the BTC/USD pair. The channel support at $10,150 is very important since the same level was a resistance earlier and now it is a good buy zone. Moreover, the 38.2% Fib retracement level of the last wave from the $8,250 low to $11,160 high is near $10,040.
Bitcoin Price Weekly Analysis BTC USD
Therefore, if the price corrects lower from the current levels, it could find support near $10,000. On the upside, the price has to break the $11,160 level to gain momentum towards $11,600 and $12,000.
Looking at the technical indicators:
4-hours MACD – The MACD for BTC/USD is placed strongly in the bullish zone.
4-hours RSI (Relative Strength Index) – The RSI is currently near the overbought levels, with no major downside sign.
Major Support Level – $10,000
Major Resistance Level – $11,600
All TPs are taken! All the figures won back that were in TA, I congratulate on the profit on the cue ball!
I see the flag and the subsequent growth on it, which led to its global bullish channel! To say that this reversal? -I think so early, though the market is already shouting!
According to GIP, our growth is planned to the level of 11200-11400 + - this is just the horizontal resistance line and the resistance line of the bullish channel!
Patterns are somewhat ambiguous, the risk is the entrance to the cue ball 40%, although they did not fully play the GIP! We are waiting 01: 00-02: 00 MSC-Asians will guide us in the right direction!
4hTF
The patterns are all overheated, but the cue ball can continue to warm, so that the risk of entering the coin is already 55-70%
Also, despite the flag, you can see the small pennant, let it be the continuation figures, but we are in a bear wedge (according to the classic wedge - this is the continuation figure, but this is a crypt))) watch the cycle, we can plop down and go further , higher than the previous value, namely 10400-10600
To be precise in cycles, now it can happen, if not already occur, the pressure of bears begins to predominate when the wedge goes back!
We can fall on:
10350-9900
9650-9470
9350-8880-8523
Growth
10900-11420
11640-12050
12750-13070
Bitcoin Cash Price Weekly Analysis
Key Points
Bitcoin cash price gained heavily this past week and moved above $1,400 against the US Dollar.
There is a crucial bullish trend line forming with support at $1,480 on the 4-hours chart of the BCH/USD pair (data feed from SimpleFX).
The pair may decline a few points in the short term, but it remains supported near $1,450 and $1,400.
Bitcoin cash price is trading nicely in the bullish zone above $1,400 against the US Dollar. BCH/USD is likely to remain in an uptrend with resistances at $1,600 and $1,750.
Bitcoin Cash Price Support
There were decent gains from the $1,180 this past week in bitcoin cash price against the US Dollar. The price gained heavy bullish momentum and it was able to move above the $1,200 and $1,400 resistance levels. It even traded above the $1,500 level and formed a high near $1,617. At the moment, the price is correcting lower, but it remains supported on the downside above $1,400.
An initial support is around the 23.6% Fib retracement level of the last wave from the $1,186 low to $1,617 high. There is also a crucial bullish trend line forming with support at $1,480 on the 4-hours chart of the BCH/USD pair. The pair is currently showing a few bearish signs, but there are many supports on the downside at $1,450 and $1,400. The mentioned $1,400 is significant since it is the 50% Fib retracement level of the last wave from the $1,186 low to $1,617 high.
Bitcoin Cash Price Weekly Analysis BCH USD
Therefore, any major dips from the current levels are likely to find bids near $1,400. On the upside, a break above the $1,600 level is needed for a test of the $1,700 level, followed by $1,750.
Looking at the technical indicators:
4-hours MACD – The MACD for BCH/USD is placed nicely in the bullish zone.
4-hours RSI (Relative Strength Index) – The RSI for BTC/USD is moving higher towards the 70 level.
Major Support Level – $1,400
Major Resistance Level – $1,750
Ethereum Price Weekly Analysis
ETH price succeeded in moving higher this past week to trade above $900 against the US Dollar.
There is a key ascending channel forming with support at $880 on the 4-hours chart of ETH/USD (data feed via SimpleFX).
The pair may continue to rise as long as the mentioned $880 support is intact.
Ethereum price is placed nicely in the bullish zone against the US Dollar and Bitcoin. ETH/USD is currently correcting lower, but it remains supported above $880.
Ethereum Price Support
There was a fresh start of an upside wave in ETH price from the $710 swing low against the US Dollar. The price gained upside momentum and moved above the $800 and $900 resistance levels. During the upside move, it traded above the 38.2% Fib retracement level of the last decline from the $1,229 high to $553 low. It also succeeded in settling above the $800 level and the 100 simple moving average (4-hours).
More importantly, there was a break above the 50% Fib retracement level of the last decline from the $1,229 high to $553 low. At the moment, it seems like there is a key ascending channel forming with support at $880 on the 4-hours chart of ETH/USD. The pair is following the channel nicely, but it may dip towards the $890-880 support area. It seems to be struggling to break the 61.8% Fib retracement level of the last decline from the $1,229 high to $553 low. However, the channel support near $880 is a crucial barrier for sellers.
Ethereum Price Weekly Analysis ETH USD
More importantly, 100 SMA is at $850 to act as the next key support. On the upside, the price has to move above the $970 and $990 levels to gain further upside momentum.
4-hours MACD – The MACD is currently showing a few positive signs in the bullish zone.
4-hours RSI – The RSI is moving lower towards the 50 level.
Major Support Level – $880
Major Resistance Level – $990
source
#ltc #latcoin #nem #eos #stellar #bitcoin #btc #icon #ethereum #eth #etc #cardano #crypto #blockchain #neo #cryptocurency
Coins mentioned in post:
| Name # | Coins | Price (USD) | 📉 24h | 📉 18.02.2018 |
|---|---|---|---|---|
| Steem | Steem | $4,41 | _-4,25% _ |  |
| BTC | Bitcoin | $10727,40 | -0,69% |  |
| ETH | Ethereum | $942,48 | -2,70% |  |
| XRP | Ripple | $1,15 | 0,58% |  |
| BCC | Bitcoin Cash | $1 531,98 | -1,54% |  |


I like this post and I flw u :) plz flw me .
Thanks @sadbin
This year, do not explain the transfer, SSH is encrypted, there are people trying to break the brute force. Public online VPS, while 22 ports are open, a lot of scans and an attempt to log into the system will be conducted every day. I had to look for fail2ban.
Unhealthy ? Depends whose health we are concerned about.
As above, most of these ETH Token sales offer little more than the right to re-sell your token. Similarly to how ICO's were public and now going private, the whole "buy solely so you can re-sell something with no intrinsic value" will likely seem less awesome later in 2018 - 2019.
Do we raise via Private or Public ? Have been asking myself the same question. Private can be quick and more certain, but only makes the wealthy wealthier.
I am still inclined to try to incorporate doing the hard yards and making opportunities available to individuals at home in their spare time, but this could take a lot more work for a lot less return.
Our Coin/Token will definitely NOT be offering only the right to re-sell the Coin. This could be attractive to a LOT of individuals to not need to go private, but maybe not. So will be going hard on a separate revenue generating project toward reducing the need to rely solely on ICO funds and/or be able to expense more on reaching the desired target audience instead of just whoever is willing to pay.
Does it matter who buys your Coin/Token or what they do with it? It does to us but should it?
Coins mentioned in post:
For more Analysis