Steemit Crypto Academy Homework Post for Professor [@yohan2on] - Swing Trading Style
Hello Everyone...
How are you today? Hopefully always in good condition.
After almost a month of inactivity due to various busy work activities that I cannot leave and spend a moment on vacation on weekends, today I will try to return to writing at the Steemit Crypto Academy community. To start the course for this week, I will attend a class given by professor @yohan2on which discusses "Swing Trading Style".
The market is where traders trade for profit and they use various trading styles, such as Swing Trading, Position Trading, Scalping Trading and Daily Trading according to your wishes, needs and your abilities. But in this post we will only discuss about Swing Trading.
Swing Trading is a trading style that is carried out based on a certain time span ranging from several days, weeks or even months with the aim of getting short to medium term profits and of course a good understanding of the market is needed to do so, such as chart observation, technical analysis and fundamental analysis. . Usually traders who will do Swing Trading will carry out some of these analyzes and especially technical analysis. This analysis also aims to see the support zone and resistance zone.
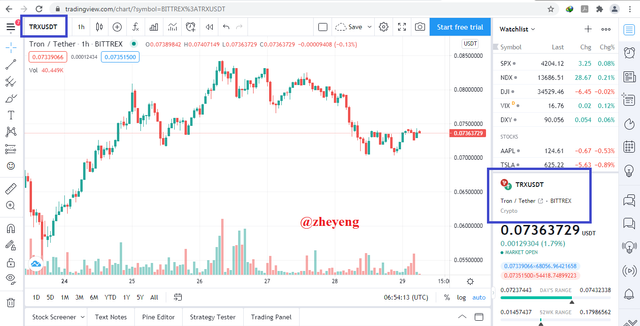
In this post I will use the TRX/USDT pair because TRX is the main coin in the Tron network and besides that TRX also has a good market capitalization and its trading volume on various exchanges is also high. To support the explanation, I will use several screenshot images of the TRX/USDT price chart that I took from the website https://tradingview.com.
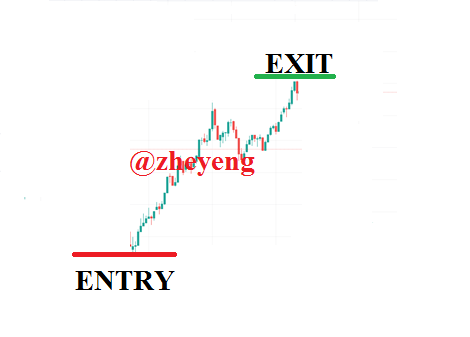
You may not be able to control the overall market trend, but you can determine what action you should take on your trades and make a good trading plan using a variety of analyzes, including determining the appropriate entry and exit points. As we all know that the cryptocurrency market is very volatile and Swing Traders can take advantage of these fluctuating conditions to reap a number of profits.
Before entering the market to trade, it is important for us to know the market trend, whether the market trend is Bullish or Bearish so that we can take the right position for each of these conditions. It should be noted that the best entry point is when the Support Zone point is formed and the best exit point is when the Resistance Zone point is formed. So we have bought at a very low price and sold it at a very high price.
In addition, you can also use various types of indicators to help you make decisions in trading, one of the indicators that is often used is the RSI or the Relative Strength Index. If the RSI value is less than 30 then an oversold condition has occurred and this is a signal for us to enter the market and buy assets, whereas if the RSI value is more than 70 then an Overbought condition has occurred and this is a signal for us to sell a number of assets that we have buy earlier and then exit the market with some profit.
To determine the right entry and exit points, usually Swing Traders will carry out a reading analysis of several chart patterns and usually the charts used are monthly, weekly, daily and 4-hour charts. Monthly & weekly charts are used to view trends, while daily charts and 4-hour charts are used to define entry & exit points and determine stop losses.
Weekly Time Frame Chart
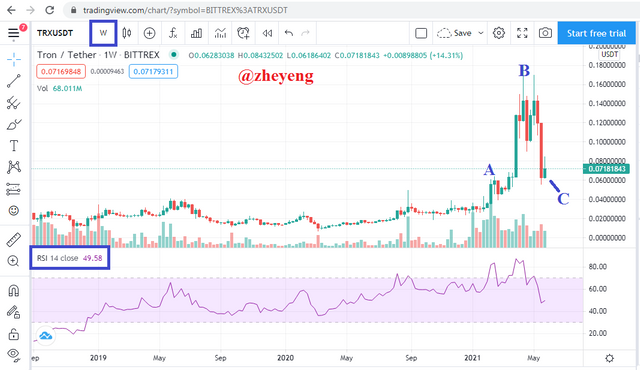
This is a more comprehensive chart and in the figure it can be seen that initially every week the TRX price experienced insignificant ups and downs, but 16 weeks ago the TRX price experienced an uptrend and managed to reach a new minor resistance point (A) and even managed to reach the major resistance point (B) at 7 last week. After experiencing a significant increase, then TRX started to experience a downtrend until today and in the past week has only experienced a slight increase. The current TRX condition can be said to be in a downtrend towards the next support zone (C). The current RSI value is 49.58 and means it is still in the middle.
Daily Time Frame Chart
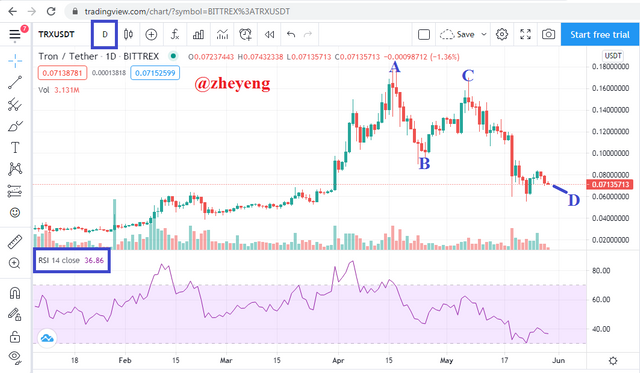
In the figure, it can be seen that from the beginning the TRX price continued to increase and had succeeded in reaching its resistance point (A), but after that the TRX price began to experience a downtrend (down to point B) and an alternating uptrend (up to point C), and finally continued to experience downtrend to date and maybe for the next few days (D). The current TRX condition can be categorized as a support zone because the RSI value is almost close to 30, the current RSI value is 36.86 and this is a signal for us to enter and buy TRX.
4 Hours Time Frame Chart
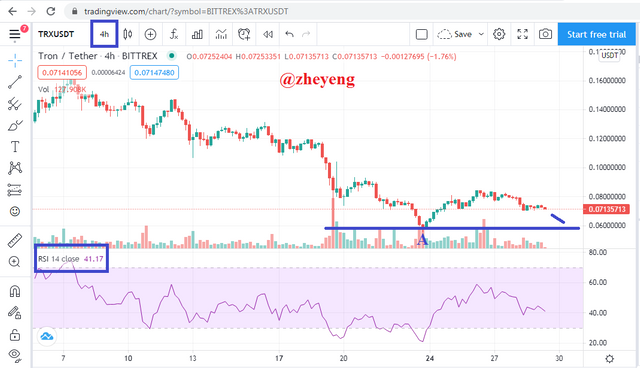
The TRX price on the shorter time frame looks like it continues to decline and means that TRX is in a downtrend and has even reached the support point (A) a few days ago, while currently the TRX price is slightly above the support point with the RSI value of 41.17.
From the three graphs, it can be said that TRX is in a downtrend with an average RSI value close to 30. Of course this is an initial signal that we can use to enter the market and buy a number of TRX gradually using part of the capital and then spend the rest capital is when the TRX price touches the support point again or when the RSI value is below 30 and in my opinion, this condition is getting closer if you look at current market conditions.
Good management is needed in trading, especially in minimizing losses because the purpose of trading is clear to make a profit and no one wants to lose. With good management and strengthened by great analysis, we can enter and exit the market appropriately, can minimize losses if market conditions do not go according to analysis, and take maximum profits. In addition, in trading, patience is also needed, of course.
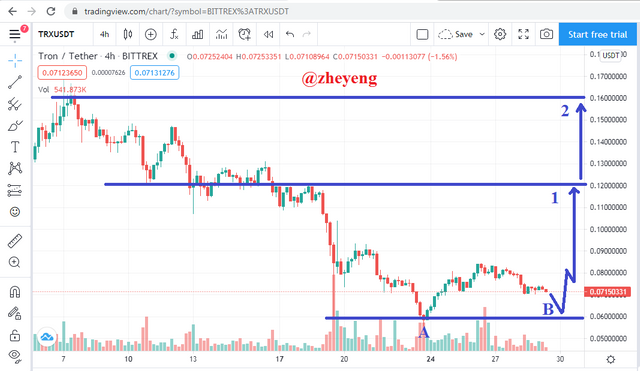
In this trade I will enter at 0.0715 and buy some TRX incrementally. If my capital for this trade is 100 USDT, then at the beginning I will only spend 25 USDT, then if the price drops to around 0.065 then I will go back to spend 25 USDT, and lastly I will spend 50 USDT if the TRX price approaches the point the previous support (A), which is 0.061 because as I explained earlier, I believe that the TRX price will reach the support point again before the price rises again. I also didn't forget to set the stop loss point at the price of 0.058 to prevent losses if the support point be broken.
Then to take some profit, I will sell TRX at two points, namely point 1 as minor resistance and point 2 as major resistance. I will sell 70% of the TRX amount at point 1 because it has a greater chance of being achieved, while I will sell 30% of the TRX amount at point 2. So I will sell 70% TRX at 0.12 and sell the rest at 0.16. I also didn't forget to set the trailing stop point at 0.105.
Keep in mind that we are not always in favorable market conditions, so we must always set stop losses in trading and be a smart trader who uses a number of analyzes before entering the market and exiting the market with a profit, you can also use various indicators to help your trades with the analysis.
Hello @zheyeng,
Thank you for participating in the 7th Week Crypto Course in its second season and for your efforts to complete the suggested tasks, you deserve a 9/10 rating, according to the following scale:
My review :
You have explained your strategy well using the swing style in trading. Your analyzes are very precise and your methodology is clear. What is missing from your writing is the extraction of other signals using technical analysis indicators.
Thanks again for your effort, and we look forward to reading your next work.
Sincerely,@kouba01