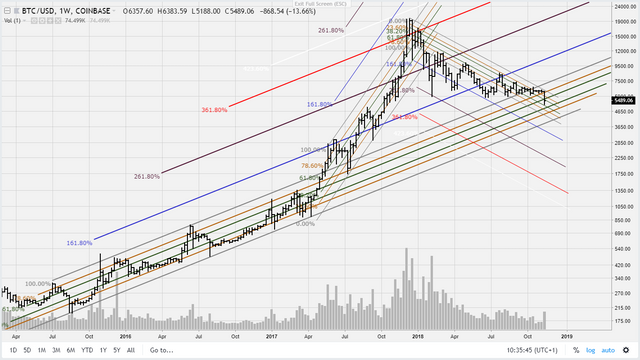
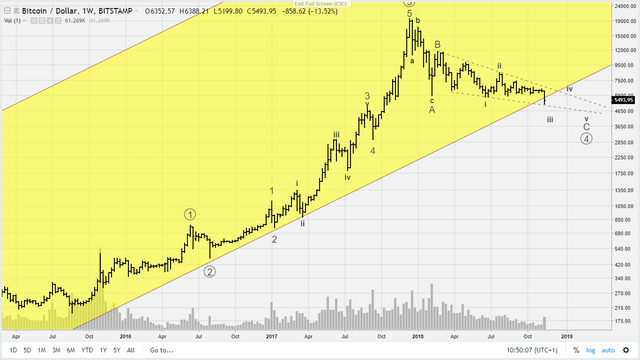
It's a wedge, now what?
After the drop this week things have changed a bit, but not that much. I'm still counting an ending diagonal. I think the contracting triangle with a near horizontal bottom is no longer valid. We are now in a falling wedge - which is a continuation pattern. The long term bullish expectations stay intact.
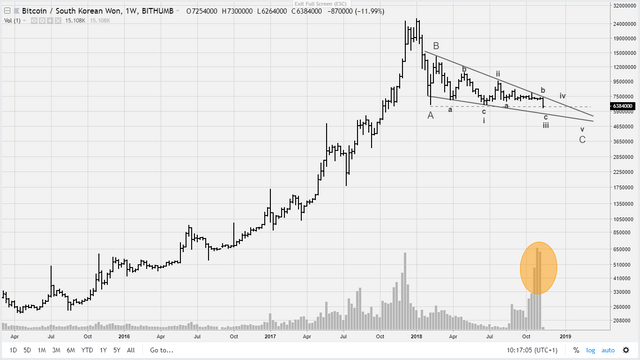
Because the ending diagonal is taking its sweet time to complete, it seems a good idea to subdivide it into threes, as in the above chart displaying bitcoin in South Korean wons. The triangle wave v of last week turned out to be not a reversal pattern but a continuation pattern triangle completing wave b of a larger wave iii within the same ending diagonal.
Following the above chart we have more room to the downside in both price and time. If my lines are drawn somewhat correctly then we can remain in the wedge until approximately March 2019 with a price target of around 4650$.
By the way, only in the South Korean won there is large volume to be seen in the 3 weeks before the drop, but not on the drop itself, contrary to most other exchanges. Not sure how to interpret that.
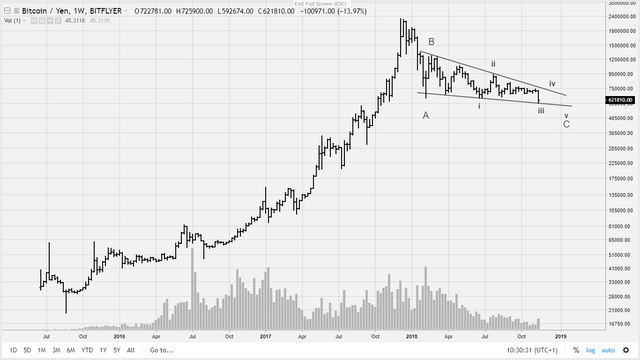
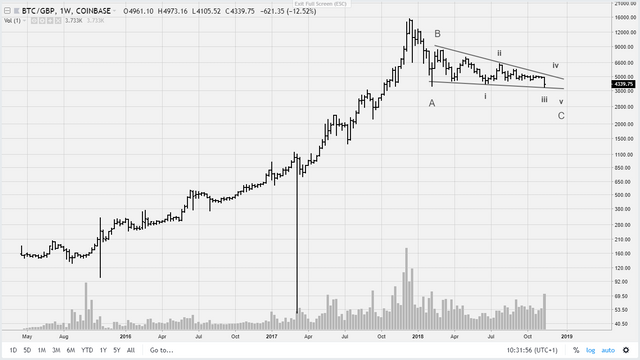
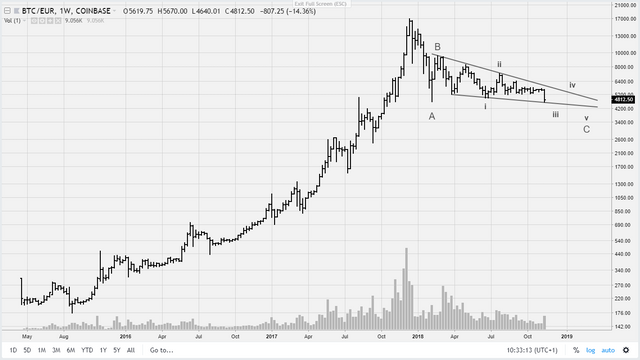
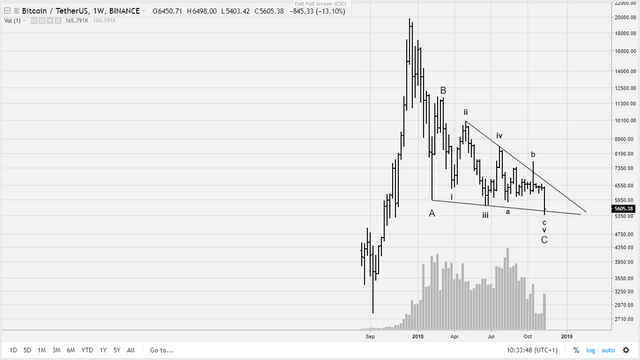
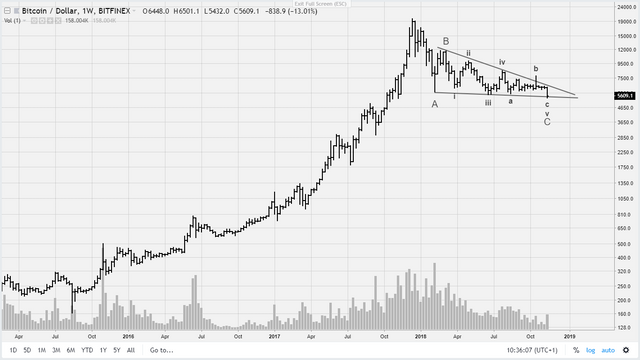
I will now give a couple of charts of bitcoin priced in other currencies and, for the USD, different markets, as prices differ slightly between them and consequently make slightly different patterns. You will see how difficult it is to assess this market. What is not difficult is that you have to wait with buying until prices break out of the the falling wedge to the upside. Not that I have followed this sensible advice. I've increased my position already.
JPY
GBP
EUR
USD Binance
USD Bitfinex
USD Bitstamp
USD Coinbase