What’s your next move on Bitcoin/USD trading? – Check out this multi-time frame technical analysis
The Bitcoin is generally bullish. So if you are thinking of making a trading decision on whether to buy or sell. You need to keep in mind that the Bitcoin market is currently dominated by buyers. This is so because the market lies above the exponential 200 days’ moving average; implying that it’s a strong buying market. If you are a smart Contralian trader and are good at risk-taking, you may opt to find selling opportunities in the lower time frames.
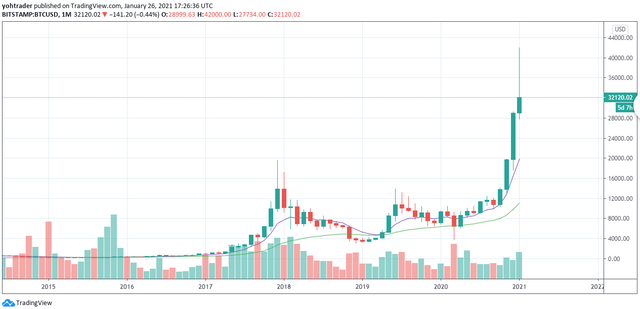
Let’s take a look at the Monthly trading chart
Since the bitcoin already broke the $20k resistance for the previous date 01/12/2019. The former resistance is now its strong support zone signifying that there are very minimal chances of it dropping below $20k.
The market is currently taking a retracement after a long bullish run. In my opinion, it’s certainly still on the strong bullish move upwards. So a trader will have to look for buying signals and take advantage of the strong uptrend after the retracement.
There is the likelihood of a retest of the former pick price at $41979. When markets move in an uptrend to a new zone/price, they often times make retracements then eventually make a retest of that newly formed price level. So a trader will want to take that into notice as he established a strong confident decision in placing a buy order in this market.
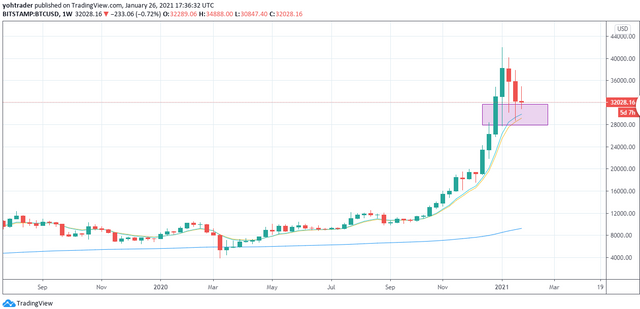
Weekly trading chart
The market is currently in a neutral state. It’s quite hard to trade in this market scenario. However, It’s still a strong bullish market; seeing that the market lies above the 200EMA. According to the weekly trading chart, the market is undergoing a retracement. I believe it will eventually resume its strong uptrend course. So if you are to take a decision to trade in this scenario on a weekly timeframe. A trader needs to look out for good buying opportunities so that he takes advantage of the strong buying market.
I have highlighted that zone on the chart. What does it mean? It’s a newly formed strong support zone. The market price behavior is just signaling that it is preparing to go upwards after an establishment of that strong support zone that is coupled with such long downward wicks formed on the candlesticks, signaling a strong price rejection.
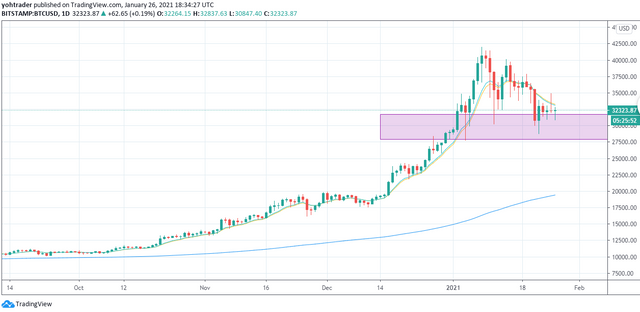
Daily time frame
On the daily time-frame, the market lies above the 200 exponential moving average showcasing that it’s also a strong buyers market in the daily time frame.
We buy at support and sell at resistance. The market has formed a strong support zone on more than two price levels that are around $28k. You don’t want to risk and place a sell order in that market situation. A trader will therefore have to look out for buying opportunities on a daily time frame.
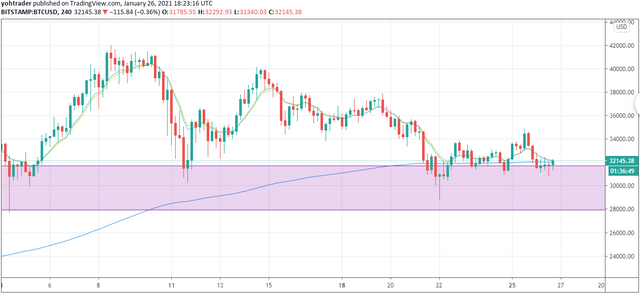
4 hourly time frame
On the 4 hourly trading chart, it’s a ranging market. Such market scenarios are highly risky to trade in as the market is still undecided on which direction it is to take. However, a scalp trader can look out for trading opportunities in the 1 hourly chart. Trading here can mostly be done in a short time which makes it ideal for scalp traders. Since the higher time frames are signaling that it’s a strong buying market. In my opinion, traders have to look out for buying opportunities as they flow with the general uptrend.
Disclaimer
Trading cryptocurrencies is a highly risky venture. Invest money that you can afford to lose. The information in this blog is gathered up according to my own technical analysis. Please take plenty of studies or seek financial advice from your financial adviser before considering investing in crypto trading.


This is such great analysis! Thank you for sharing, it was really easy to understand and useful! :)
You are welcome! Thanks for reading. I am glad you found it valuable.
You are welcome! Thanks
For reading. I am glad you
Found it valuable.
- yohan2on
I'm a bot. I detect haiku.
Shared on Twitter