[Basics to trade cryptocurrencies correctly, Part 1] - Crypto Academy / S6W1 - Homework post for professor @nane15
Hello friends, you are welcome to my blog as engage in the SCA lessons and homework Tasks. For this post, I will be responding with my contribution to a post made by

Question 1: What do you understand by trading? Explain your understanding in your own words.
Whenever the word trading is mentioned, what comes into our mind is the act of buying and selling which is geared towards profiteering. No matter what the context is, trading entails that there is an exchange of a given item which may be influenced by other factors but with the sole purpose of making returns out of the transaction.
The activities surrounding Trading may be greatly affected by the forces of demand and supply which hence affects the market behavior and pressure therein. These trading activities are known to have players on which it depends to derive its value at any given time. This activity may also be driven by the buying and selling pressure which are great determinants of demand and supply forces.
When there is high trading pressure with buyers having the day, the value of that given asset or commodity is expected to go up but when it is skewed towards Sellers, the asset price is definitely going to lose some value. This goes with this theory as follows;
Demand > Supply = Value appreciates
Demand < Supply = Value depreciates
In addition to this, liquidity availability which also determines the ease of exchanging products in trading activity at will, surplus, or scarcity which is an integral player vis-a-vis supply and demand sets in.
In simple terms, when there is scarcity, the value of products is observed not to be easily traded which hence increases its value whereas excess supply into the trade reduces and devalues the asset. But in all, there is some key trade analysis that is great influencers in driving trade activities in the market though still following the principles of demand and supply activities which are underlying factors therein.
The Fundamental Analysis: this is one of the first analyses to look out for before engaging in any trade activities in an asset. Just as the name fundamentals, the basis on which the project is afloat or in existence should be considered. Does it have a viable project that is goal-driven with developmental strides in it, does the policies guiding its day-to-day growth well-founded and funded to enable continuity. Does the available data and news around its project or asset more appealing to impact value. Therefore a fundamental analysis gives an overview of how a project or asset would run both in the short and long term which vis-a-vis would impact the value of asset traded.
Technical Analysis: This is another analytical tool that helps in providing chart patterns, indicators, and price action for the sole purpose to improve trading activities geared towards profiteering. This kind of analysis provides for both short and long-term periods with more possibilities in enhancing trade activities in the market. This also provides risk aversion tools that reduce losses incurred during trade and as well as provide higher leverages to trade in profit.
Sentimental Analysis: Just as the name, sentiments, it simply works with the emotions or behavioral changes of the traders. This may be influenced by either what they see or hear from media/social platforms which in turn affects their trading action. Fear of Missing Out is as well result of this kind of analysis. This type of analysis comes with its gains as well as losses too.
Question 2: What are the strong and weak hands in the market? Be graphic and provide a full explanation.
The Strong Hands in the Market
In the market, it is obvious that there is this presence of the strongholds whose influence distort the price values evident in the Market because of the volume of orders they execute. That is to say, this set of individuals or people are mighty in their decision to either initiate a bull market or a bear market as they wish.
These strong hands in the market are the institutional man, the banks, other financial institutions. The Elliot wave theory categorizes this set of persons as the institutional man who uses the Accumulation and Distribution market strategy to execute their orders or represent their activities in the market.
In the Accumulation scenario, we observe a situation where this institutional man emerges so much wealth or this product which hence gradually increases the buying pressure in this area. At this point, the low-value asset starts gaining more value with a gradual price increase.
For the Distribution scenario, this is a stage that emanates from the activities of accumulation where heavy acquisition of a given asset is acquired. This causes a gradual spike in asset prices. Then at this distribution region, where asset price has reached its overbought status and profit-taking inevitable, the institutional Man starts selling off this accumulated wealth with a downward price value of the given Asset.
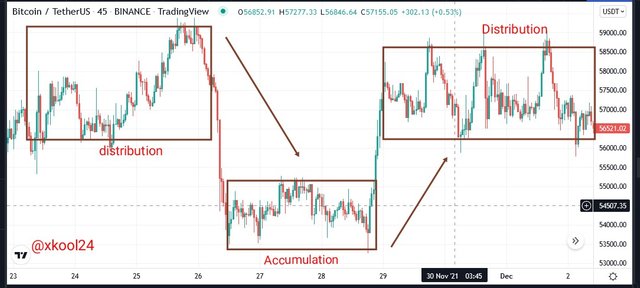
The Weak Hands in the Market
This set of individuals is the receivers of the aftermath effect of the institutional man or Strong Hands in the market. These people are observed to be Retailers, private persons with a relatively low income or influence in market activities.
There's a relatively low capital with this class of persons to accumulate stocks but a smart trader would want to follow the trail of the strong hand individuals to profiteer from their trade activities.
Question 3: Which do you think is the better idea: think like the pack or as a pro?
No one would want less value or be allowed to be pushed around as a pack, Ceteris Paribus. I would also rather think like a PRO but this would come with a Price which is mastering the required technical skills and applicable trading tools to help execute orders as required.
Moreso, thinking like a PRO would also entail that one would be amongst the trade deciders who can change the course of the market trends with heavy order execution. Hence there is more room open for profit-taking when one thinks like a PRO.
Let's quickly remember that thinking like a PRO simply means that one is among the Strong hands in the market due to the capacity to execute larger orders, influence the demand and supply forces which in turn right get affect the buying or selling pressure.
Question 4: Demonstrate your understanding of trend trading. (Use cryptocurrency chart screenshots.)
Trends happen to be one of the leading trading signals that guide traders on how best to follow the price movement of traded assets at any given time. There are many trend-based indicators in this regard that help in identifying trends during trading.
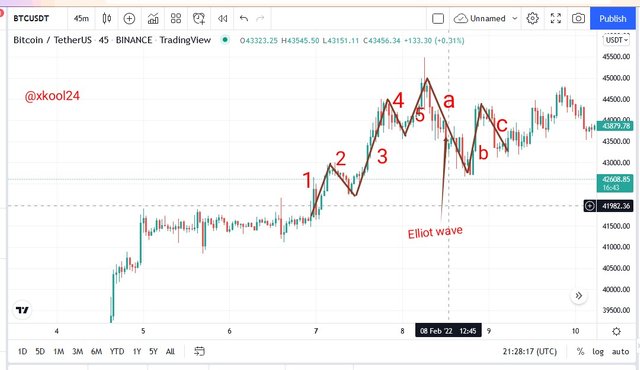
In demonstrating my understanding of trend trading, I will be determining this using the Elliot Wave theory on trends. In his theory emphasis was made on the impulsive and corrective wave trends in the chart analysis where the impulsive waves are made up of 5 waves and the corrective waves come with 3 waves.
In identifying the impulsive 5-waves, the 1, 3, & 5 waves are impulsive in their trend whereas the 2 & 4 waves are corrective in their pattern. Whereas for the Corrective 3-waves, the 1 & 3 waves are impulsive and the 2nd wave is corrective in its pattern.
In addition to the Impulsive Leg of the 5-Waves, the 2nd wave should not be below the 1st wave, wave 4 shouldn't meet the peak of the first wave but more distinctively, the 3rd wave should be the longest in its structure.
Lets us see a typical example of this scenario I. The image below;
Question 5: Show how to identify the first and last impulse waves in a trend, plus explain the importance of this. (Use cryptocurrency chart screenshots)
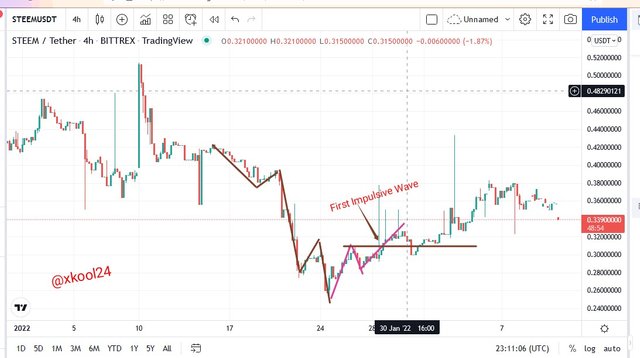
Identifying the First Impulsive Wave
Identifying the first impulsive wave starts when the 5th wave is identified relative to the corrective waves of b and c. In a typical downtrend scenario, we will observe that wave c should peak above the Peak seen in the wave which definitely would want to form a repetition of a new trend cycle.
Then for a typical uptrend scenario, this same process where wave c will peak but below wave, a is observed which possible formation of a new trend cycle.
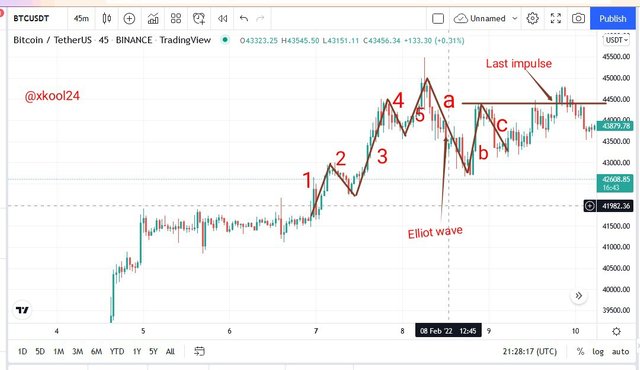
Identifying the Last Impulsive Wave
In this scenario where we need to identify the last impulsive wave, we have you look out for the formation of Elliot's impulsive and corrective wave patterns. Therefore the Wave-5 is necessary to be observed as well as the corrective 3-waves. We would have to observe the peak of the Corrective wave-2 which should be lower than the impulsive wave 5. See the image below for more illustrations.
Question 6: Show how to identify a good point to set a buy and sell order. (Use cryptocurrency chart screenshots)
In identifying the buy and sell order, a good representation of the first and last impulse is good but and sell points for any trader. Let's see a good description of this different use case.
For a Buy Order Scenario
For a good buy order scenario, we should be able to identify the full Elliot wave on our chart analysis. For a better representation of this order, we should be able to look out for an Uptrend after identifying the Impulsive Wave 5. After this, we should be able to draw a resistance line where corrective wave c is closing below wave 5 and wave c close above wave a to identify a buy position. The Stoploss is best below the impulsive wave 5.
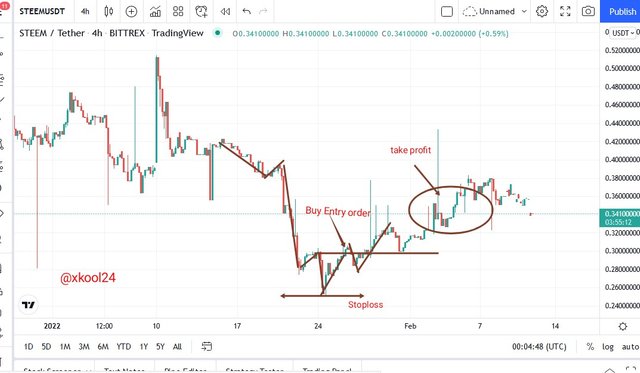
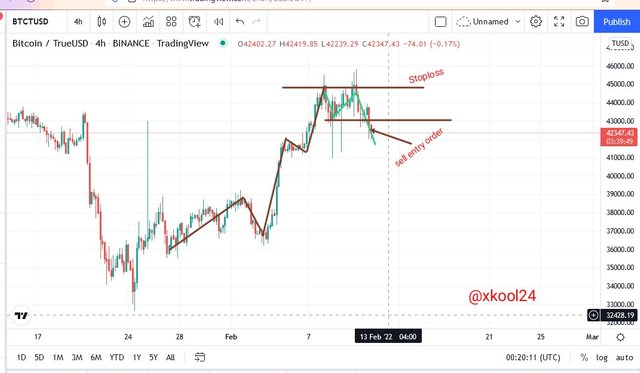
For a Sell Order Scenario
For a good Sell order scenario, we should be able to identify the full Elliot wave on our chart analysis and the ability to identify wave 5 in particular. For a better representation of this order, we should be able to look out for a Downtrend after identifying the Impulsive Wave 5. After this, we should be able to draw a resistance line where corrective wave c is closing below the impulsive wave 5. The Stoploss is best above the impulsive wave 5.
Question 7: Explain the relationship of Elliott Wave Theory with the explained method. Be graphic when explaining.
Elliot Wave theory & Wyckoff Method
The Elliot Wave theory as well the Wyckoff Method share the same concept of trend trading in its build-up. Each of them pays more details on trends to build up in a given market.
When we look at the Impulse and corrective waves of the Elliot wave theory, we will understand that the corrective leg wave which crosses and closes above or below the wave "a" for either an uptrend or downtrend scenario clearly indicates a new beginning for a new trend.
On the other hand, the Wyckoff Method shares some form of similarities in the build-up of a new trend. This method uses the Accumulation and Distribution stages to show places for possible trend continuation as well as possible trend reversals which characterize either high buying pressure or high selling pressure.
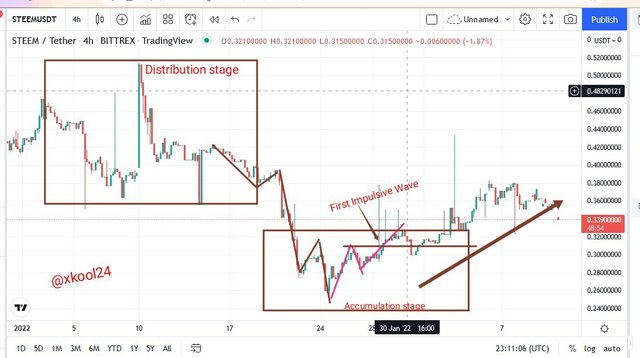
Above is a graphic representation of both concepts which also clearly shows the different stages where we have trend build-up before an anticipated uptrend or downtrend movement.
Conclusion
Trading which represents the exchange of traded assets in such a manner that profits are made is as well guided by a Trend that vis-a-vis shows the direction of price movement. Identifying trends during trading is an important signal because of its ability to give clear insight on the best applicable strategies for use. The Elliot Wave theory which is characterized by the Impulsive and Corrective leg waves comes with a ZigZag pattern that captures price action in its peaks and Lows. On the other hand, the Wyckoff Method uses the Accumulation and Distribution for possible trend continuation and reversal.
It was nice participating in your class, Prof @nane15.
All images used are screenshots from. The tradingview site.